Direct answer: Presenteeism is when an employee keeps coming to work while ill, so output drops. Absenteeism is the opposite: the employee stays away because of illness. The attendance record shows absence, but it does not show presenteeism. You can measure it with 3 questions on a 0-to-10 scale from the HPQ questionnaire. Then you change the rules that push people to work while ill.
Main condition: This method applies to a small team, for example 5 to 50 people. The team needs records of work hours and 1 neutral person to hold the answers. Limit: This article is not medical advice or legal advice. HPQ scores come from self-report, so a score does not prove a diagnosis or a fault.
We opened 17 sources on 26 October 2026. The main sources are Johns (2010), Hemp (2004), the HPQ scoring memo from Harvard, reviews from IZA and the Enterprise Research Centre, and 2 Indonesian studies. We could not open the full text of Johns (2010) and Hemp (2004), so we quote only their abstracts and summaries by other authors. The team numbers in the simulation are dummy data, not client data.
The problem: people are present, but the work does not move
Think of an online shop admin who comes in with a headache. The admin answers customer chats more slowly than usual. 1 order goes out with a wrong address. The attendance record for that day still says "present".
Hemp (2004) opens his Harvard Business Review article with a similar case. A design engineer at International Truck and Engine works with seasonal allergies. The engineer seldom misses a day, but finds it hard to focus on the screen all day.
A small business owner usually counts only days of absence. You can see a day of absence. A day of "present but not functioning" does not appear in any report.
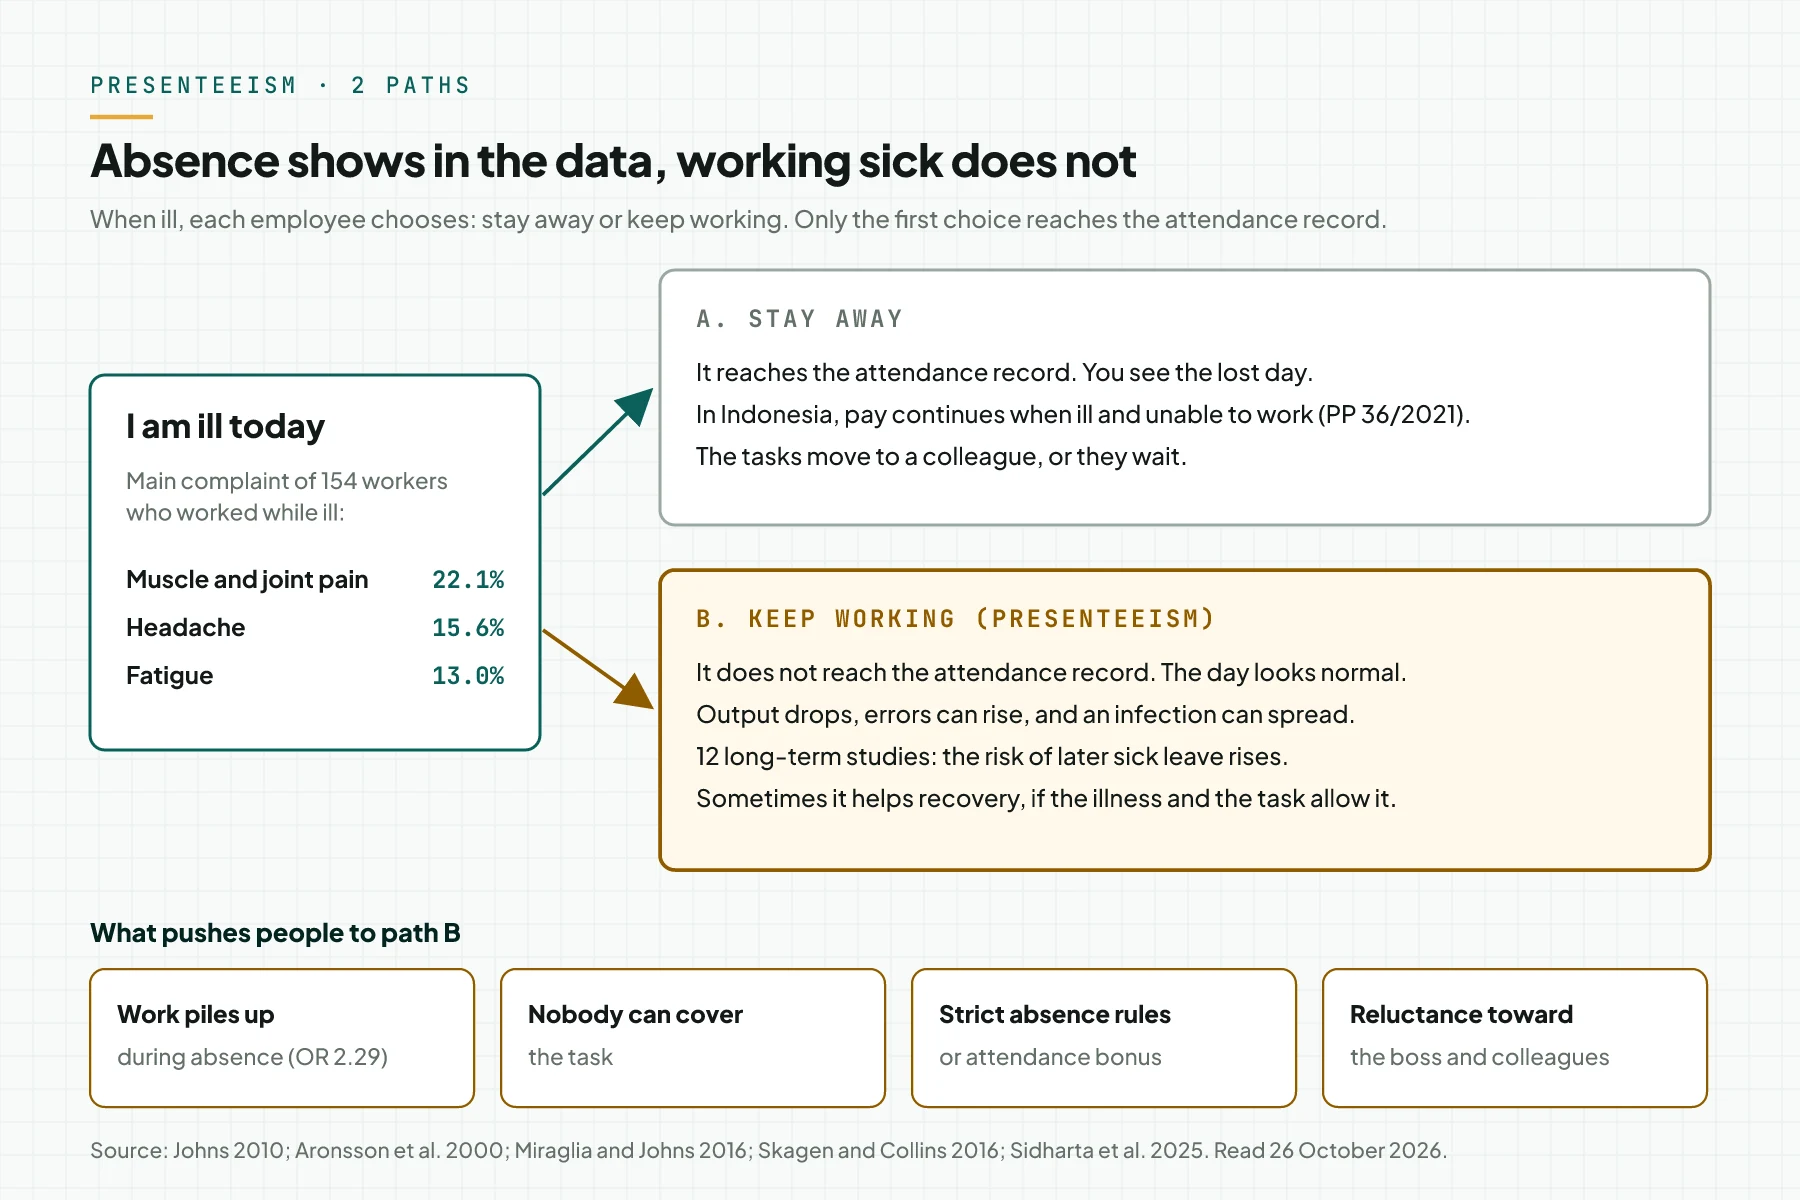
The pattern is common. Schnabel (2022) quotes the 2015 EWCS survey: 42% of EU workers worked while ill at least once in 12 months, and 46% were absent for health reasons. In Indonesia, Sidharta et al. (2025) surveyed 590 formal sector workers from February to July 2023. 26.1% (154 people) reported a health problem that disturbed their work in the past month.
Output can also drop for other reasons, for example while a team learns a new tool. The article on the digital transformation J-curve covers that type of drop. Presenteeism is different, because its cause is a health condition.
How it works: why people come to work while ill
Presenteeism is not only about hard-working staff. Research finds triggers at 3 levels: the person, the task, and the company rules.
1. Two definitions for 1 problem
Johns (2010) defines presenteeism as attending work while ill. His review in the Journal of Organizational Behavior covers the origin of the term, its definitions, how it is measured, and the related organizational factors.
Hemp (2004) uses a definition based on the result. The employee is on the job, but does not fully function because of illness or another medical condition.
Hassard and Dulal-Arthur (2026) write that the first definition is common in Europe and the second in North America. According to their summary, Johns criticizes the second definition because it mixes cause and effect. So this article keeps 2 items apart: "working while ill" for the behavior, and "lower output" for the result.
2. Triggers from tasks and rules
Aronsson et al. (2000) interviewed 3,801 Swedish workers by phone in 1997. 1 in 3 people worked 2 or more times in 1 year although they felt they should take sick leave. Workers who must clear their own backlog after an absence had an odds ratio of 2.29 for presenteeism.
Miraglia and Johns (2016) combined 109 samples with 175,965 participants. The main correlates are poor health, constraints on absence such as strict absence policies and job insecurity, job demands, stress, and low support. Positive attitudes also correlate: satisfaction, engagement, and commitment.
Schnabel (2022) sums up the reasons that workers give: workload and deadlines, professionalism, and guilt toward colleagues. The same review notes that firm size makes no difference, but strict absence policies correlate with more presenteeism.
Sidharta et al. (2025) describe 2 patterns of work culture in Indonesia. Workers keep good relations with superiors and colleagues, and workers avoid leaving tasks behind with no backup. Some companies also pay incentive money when an employee takes no leave at all.
So many triggers are in the hands of the business owner: work that piles up, no backup, and rules that punish absence.
3. What it costs
Hemp (2004) quotes estimates of more than 150 billion dollars a year for US companies. The summary of his article says that this is much more than the cost of absence.
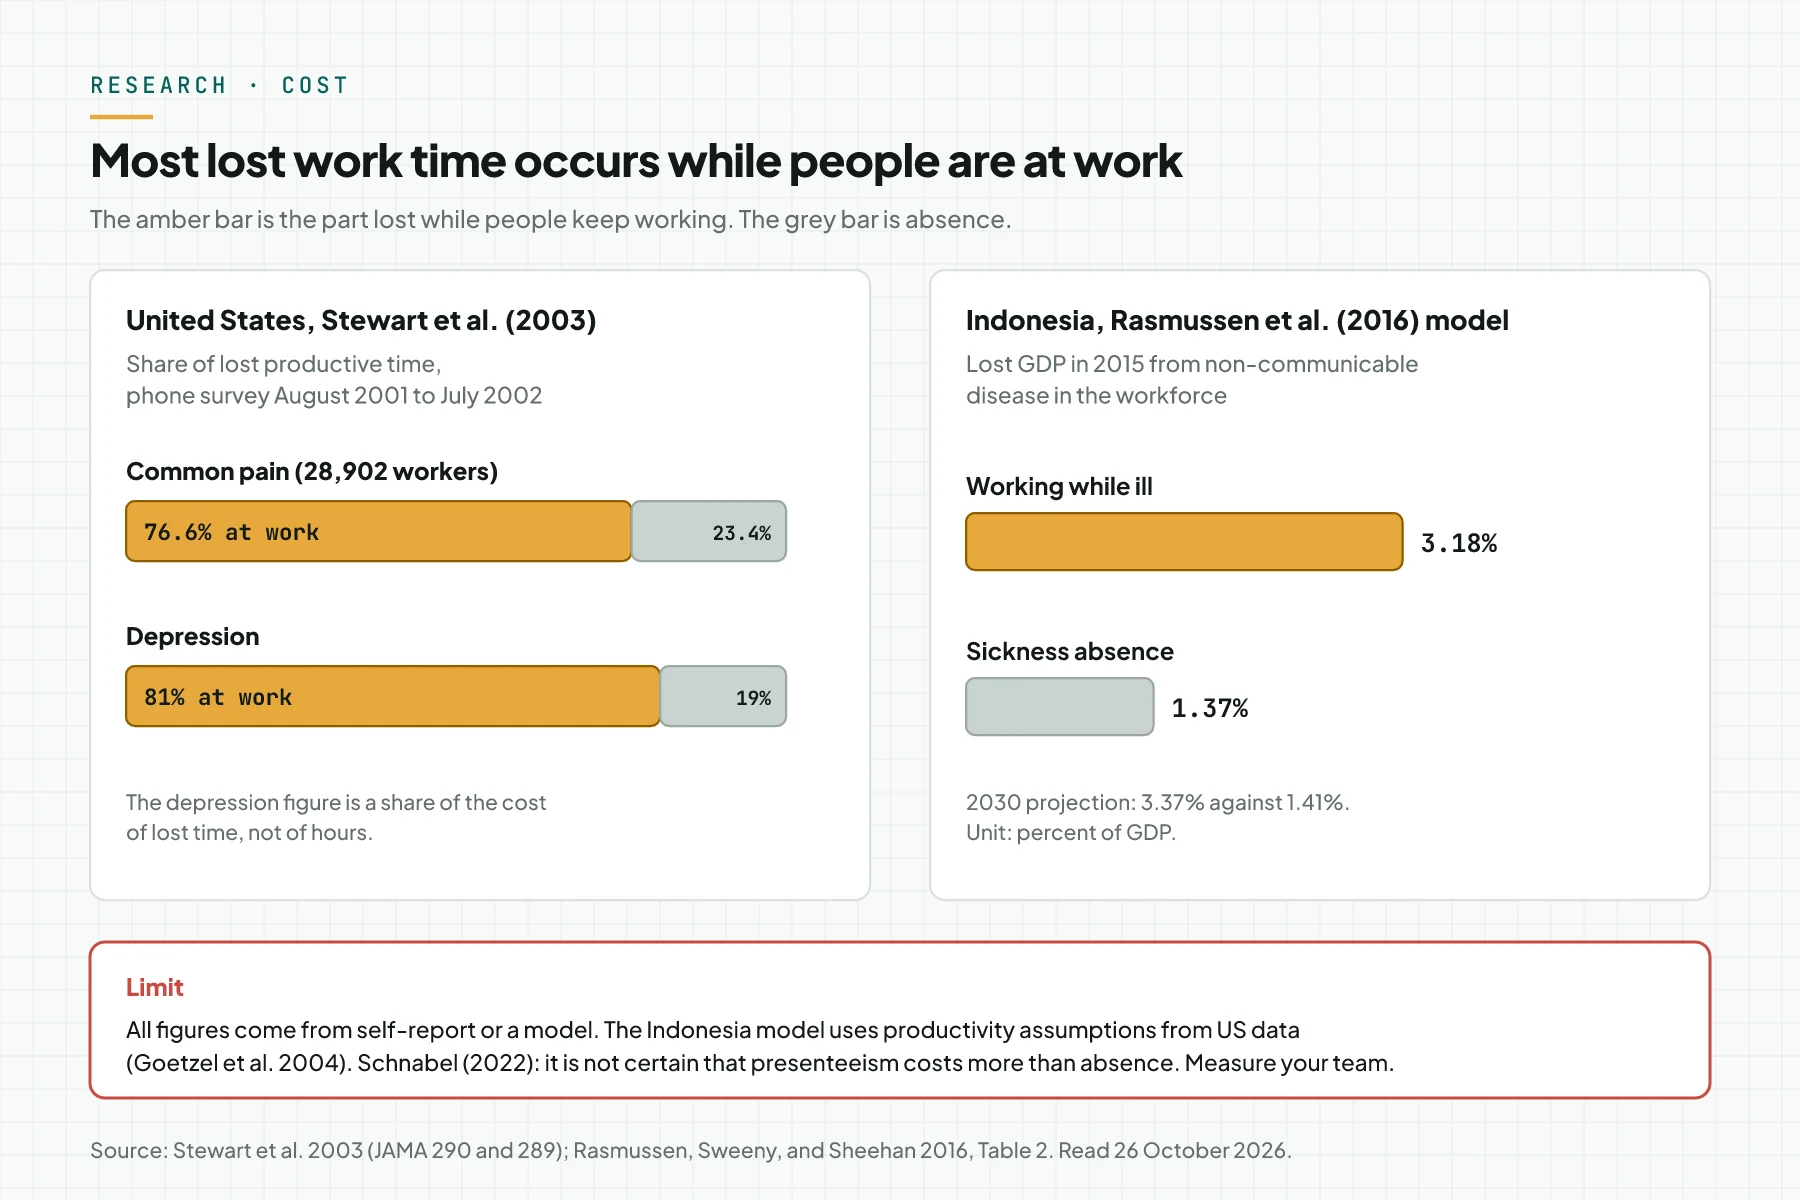
Stewart et al. (2003) surveyed 28,902 US workers. For common pain, 76.6% of lost productive time occurred while people kept working, not during absence. In their depression study, 81% of the cost of lost time came from lower performance at work.
Collins et al. (2005) measured Dow Chemical employees with the Stanford Presenteeism Scale. Work ability fell by 17.8% to 36.4%, depending on the condition. The total cost of chronic conditions equaled 10.7% of labor cost, and 6.8% came from lower performance at work alone.
Goetzel et al. (2004) calculated 10 health conditions. Presenteeism made up 18% to 60% of all costs for these conditions. For many conditions, presenteeism cost more than medical treatment.
For Indonesia, Rasmussen, Sweeny, and Sheehan (2016) modeled the GDP loss in 2015 from non-communicable disease in the workforce. The result was 3.18% of GDP from presenteeism and 1.37% of GDP from absence.
4. Limits of the evidence
Schnabel (2022) writes that it is not certain that presenteeism costs more than absence. Many studies use self-report and data from 1 point in time, so cause and effect are not proven.
The Indonesia model uses productivity loss assumptions per disease from Goetzel et al. (2004), which come from US company data. So 3.18% is a model result, not a survey result from Indonesia. The summary table of that report also swaps 2 column labels, so we use Table 2, which shows absence and presenteeism apart.
5. Not all presenteeism is harmful
Hassard and Dulal-Arthur (2026) separate 2 paths. The first path occurs because people avoid absence, and this path is often harmful. The second path occurs because work supports routine, identity, and recovery.
Schnabel (2022) writes that work during illness can help recovery, if the illness and the task allow it. But Skagen and Collins (2016) reviewed 12 long-term studies. Most of them found that presenteeism today raises the risk of later sickness absence and lowers self-rated health.
Rama Digital recommendation: do not aim for zero presenteeism. Aim for the correct decision: rest when the illness is contagious or severe, and do light work when the condition allows it.
Compared: absenteeism, presenteeism, and virtual presenteeism
Team meetings often mix up these 4 terms. The table separates the meaning, the measure, and the source.
| Term | Meaning | Shows in attendance? | How to measure | Source |
|---|---|---|---|---|
| Absenteeism (sickness absence) | The employee stays away from work because of illness. | Yes | Lost hours: 4 x B4 minus B6 in the HPQ. | Kessler et al. (2003) |
| Presenteeism as a behavior | The employee comes to work while ill. | No | Question: how often did you work while ill in 12 months? | Johns (2010), Aronsson et al. (2000) |
| Presenteeism as a result | The employee is present, but output drops because of a health condition. | No | Performance scale 0 to 10 (HPQ B11). | Hemp (2004), Kessler et al. (2003) |
| Virtual presenteeism | The employee keeps working from home while ill. | No | Same as the 2 rows above. | Schnabel (2022) |
Only the first row appears in the attendance record. The other 3 rows need a direct question to the employee.
Before you start: prepare 5 things
- The work hours that you expect per person per week.
- 1 online form with no name field, or with 1 code per person.
- 1 neutral person who holds the list of codes, for example the finance admin.
- A list of daily tasks per person.
- The current sick leave rules and attendance bonus.
Law 27 of 2022 on Personal Data Protection classifies health data and information as specific personal data. So do not ask for a diagnosis. Ask only about work hours and performance.
Step 1: Send the 7 HPQ questions every 4 weeks
The HPQ (Health and Work Performance Questionnaire) is a self-report questionnaire from Kessler et al. (2003). Its first calibration compared HPQ answers with company archive data in 4 groups: 441 airline reservation agents, 505 customer service staff, 554 car company executives, and 850 railroad engineers.
The HPQ scoring memo (1 May 2007, updated 8 January 2024) lists 7 core questions for absence and presenteeism. The 2024 update removed WHO ownership from the HPQ. On 26 October 2026, the HPQ page had no official Indonesian version, so the Indonesian edition of this article uses our own translation.
| Code | Question (short form wording) | In the formula? |
|---|---|---|
| B3 | About how many hours did you work in the past 7 days? | Yes, for the 7-day version. |
| B4 | How many hours does your employer expect you to work in a typical 7-day week? | Yes. |
| B5 | In the past 28 days, how many days did you miss a full day, miss part of a day, or work extra? | No. It helps you recall before B6. |
| B6 | About how many hours did you work in the past 28 days? | Yes. |
| B9 | On a 0-to-10 scale, how do you rate the usual performance of most workers in a job similar to yours? | Yes. |
| B10 | On the same scale, how do you rate your usual job performance over the past 1 to 2 years? | No. It helps you focus on the past 4 weeks. |
| B11 | On the same scale, how do you rate your overall job performance on the days you worked in the past 28 days? | Yes. This is the main number. |
Send the form on the same date every 4 weeks. The HPQ memo asks users to cite its 2 method papers when they publish survey results. Check: at least 80% of the team answers, and the form has no diagnosis field.
Step 2: Calculate the absence score and the presenteeism score
Use the 3 formulas from the HPQ memo. Absolute presenteeism equals 10 x B11, with a range of 0 to 100. Relative presenteeism equals B11 divided by B9, kept between 0.25 and 2.0. Relative absence equals (4 x B4 minus B6) divided by (4 x B4).
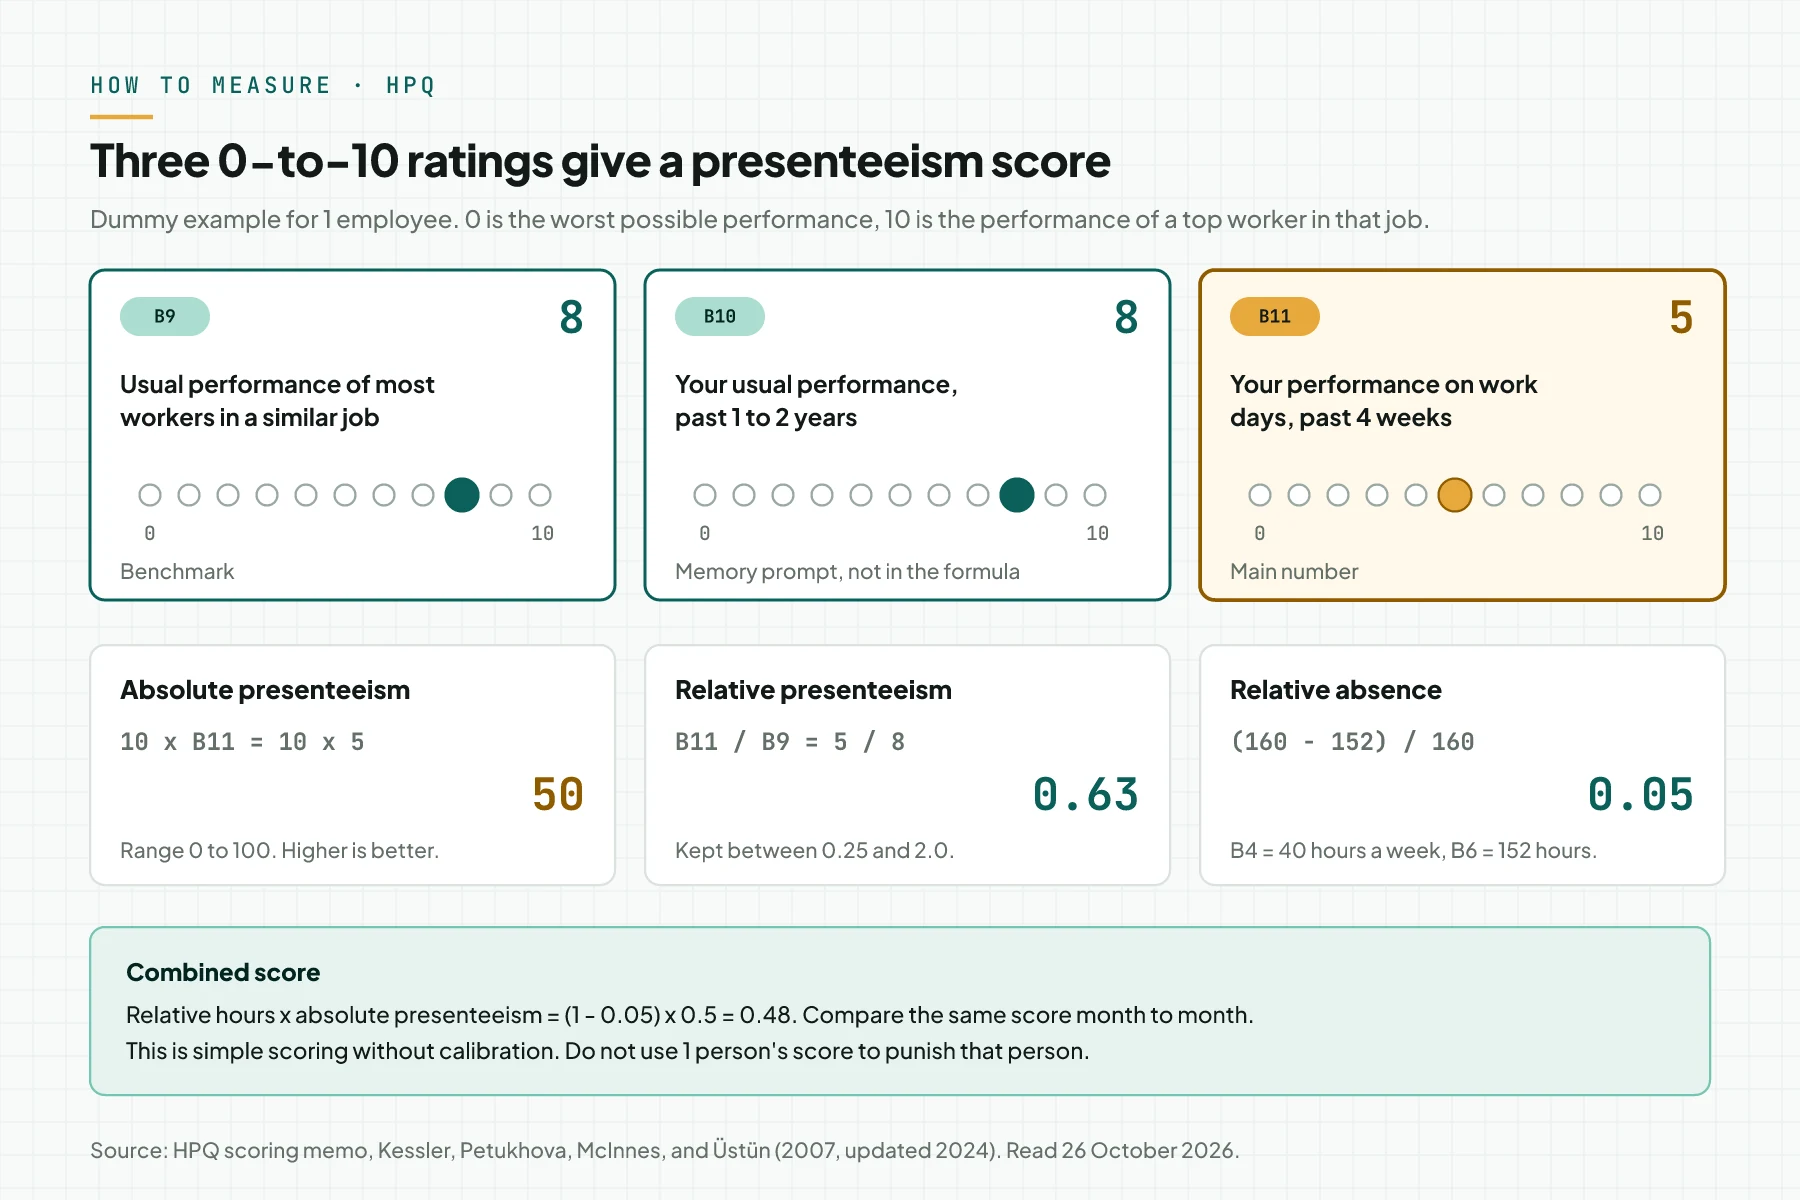
The HPQ memo calls this simple scoring. The full HPQ uses calibration to archive data, so simple scoring is suitable only to follow a trend in the same team. Check: each absolute score is between 0 and 100, and each relative score is between 0.25 and 2.0.
Step 3: Find the triggers with 4 team questions
The scores show where output drops, but they do not show why. Discuss these 4 questions in a 30-minute team meeting, without individual scores:
- Does your work pile up when you are absent?
- Who can do your tasks today if you stay home?
- Does 1 day of absence cut your bonus, your rating, or your pay?
- Do you feel uneasy toward your boss or colleagues when you report sick?
Questions 1 and 2 come from the findings of Aronsson et al. (2000). Question 3 comes from the finding of Miraglia and Johns (2016) on absence rules. Question 4 comes from the notes of Sidharta et al. (2025) on work culture in Indonesia. Check: you have a list of the top 3 triggers, and each trigger has 1 real task as an example.
Step 4: Change the rules, the incentives, and the task backups
Change the triggers that you found in step 3. Start with these 3 changes:
- Remove the "never absent" bonus and replace it with a team target bonus. According to Schnabel (2022), such a bonus raises attendance in the short term, but it can increase absence and long illness later.
- Name 1 backup person for each task that must not stop, for example customer chat or order entry.
- Write when an employee must rest, for example when an illness can spread. Also write when light work or work from home is allowed.
These rules stay within Indonesian law. PP 36/2021, Articles 40 and 41, requires the employer to pay wages when a worker is ill and unable to work: 100% for the first 4 months, then 75%, 50%, and 25% for the next periods. So pay for a sick day is already a fixed cost. The new rules only move that day from "present but weak" to "rest and recover".
If the trigger is manual work that piles up, read the article on AI tools for operations and cost per task. It shows how to calculate the cost of automation. Check: the new rules are written and shared with the team, and each important task has a backup name.
Step 5: Measure again after 4 weeks and set an escalation rule
Send the same 7 questions 4 weeks after the new rules start. Compare the team median, not individual scores. Absence cost can rise a little, because ill people now choose to rest.
Write the escalation rule before the results come in. Rama Digital recommendation: use this rule. If 1 person's B11 is 3 or more points below B10 for 2 periods, the manager talks with that person in private. The manager also suggests a visit to a doctor. The principle is the same as the stop rule in the article on the sunk cost fallacy. You write the limit before you see the result. Check: the escalation rule is written before period 2 starts, and no score goes into a performance rating.
Simulation: an online shop team for customer service and admin
This example uses dummy data. An online shop has 6 customer service and admin staff with an average wage of Rp 4,500,000 a month. Expected work time is 40 hours a week, so 160 hours per 4 weeks.
To turn scores into rupiah, we use 2 rough estimates. Absence cost equals wage x relative absence. Working-ill cost equals wage x relative hours x (B10 minus B11) / 10. The official HPQ does not use B10 in its formulas, so these rupiah figures are only for team discussion.
| Code | Hours in 4 weeks (B6) | Relative absence | B10 to B11 | Absolute presenteeism | Absence cost | Working-ill cost (rough) |
|---|---|---|---|---|---|---|
| A | 160 | 0 | 8 to 8 | 80 | Rp 0 | Rp 0 |
| B | 152 | 0.05 | 8 to 5 | 50 | Rp 225,000 | Rp 1,282,500 |
| C | 136 | 0.15 | 7 to 7 | 70 | Rp 675,000 | Rp 0 |
| D | 168 | -0.05 | 8 to 6 | 60 | Rp 0 | Rp 945,000 |
| E | 160 | 0 | 9 to 9 | 90 | Rp 0 | Rp 0 |
| F | 144 | 0.10 | 8 to 4 | 40 | Rp 450,000 | Rp 1,620,000 |
The total absence cost is Rp 1,350,000. The total estimated working-ill cost is Rp 3,847,500, almost 3 times as much. A normal attendance report shows only the first number.
| Date (simulation) | Event | What is recorded | Decision |
|---|---|---|---|
| 1 Sep | The owner sends the 7 HPQ questions through a form. The finance admin holds the list of codes A to F. | 6 of 6 people answer within 3 days. | The owner sees codes only, not names. |
| 4 Sep | The admin calculates the scores. | Absence cost Rp 1,350,000. Working-ill cost (rough) Rp 3,847,500. | Focus on the tasks that B, D, and F hold. |
| 5 Sep | A 30-minute team meeting with the 4 trigger questions. | B, D, and F hold customer chat and order entry with no backup. An attendance bonus of Rp 300,000 is lost after 1 day of absence. | Change the rules from 8 Sep. |
| 8 Sep | The new rules start. | A team target bonus replaces the attendance bonus. 2 tasks have a backup. A sick day needs only a message. | Measure again on 6 Oct. |
| 6 Oct | Measure again with the same 7 questions. | Absence cost Rp 1,575,000. Working-ill cost (rough) Rp 1,395,000. | The total falls from Rp 5,197,500 to Rp 2,970,000. Measure every 4 weeks. |
In this simulation, the absence cost rises from Rp 1,350,000 to Rp 1,575,000. The total cost falls from Rp 5,197,500 to Rp 2,970,000. These numbers are an example, and your team's result can differ.
Checklist before you change the sick leave rules
- Write down the current sick leave rules and bonus rules. Owner: business owner. Evidence: a dated document.
- Send the 7 HPQ questions with no diagnosis field. Owner: admin or HR. Evidence: the form and the send date.
- Calculate absolute presenteeism, relative presenteeism, and relative absence. Owner: the neutral person who holds the codes. Evidence: a calculation sheet.
- Discuss the 4 trigger questions without individual scores. Owner: team manager. Evidence: meeting notes with the top 3 triggers.
- Name 1 backup for each important task. Owner: team manager. Evidence: a task list with 2 names per task.
- Keep the answers apart with limited access. Owner: business owner. Evidence: a list of people who have access.
- Stop the program and get professional help when under 80% of the team answer or the median score stays flat for 2 periods. Owner: business owner. Evidence: a dated decision note.
When to handle it yourself, and when to ask for help
Handle it yourself when your team is small, work hour records exist, and 1 neutral person can hold the data. The 5 steps above are enough for that case.
Ask a doctor, a company doctor, or a psychologist for help when 1 person shows severe symptoms or signs of depression. Ask for process help when the main trigger is manual work that piles up with no backup.
Frequently asked questions
What does presenteeism mean? Presenteeism means an employee keeps coming to work while ill, so output drops. In Indonesian there is no standard term yet. Many writers use the word presenteeism or "hadir saat sakit".
What is the difference between presenteeism and absenteeism? Absenteeism is staying away from work because of illness, and the attendance record shows it. Presenteeism is coming to work while ill. The record shows the person as present, so the loss stays hidden.
Is presenteeism always harmful? Not always. Light work can help recovery when the illness is not contagious and the task allows it. But 12 long-term studies show that presenteeism often raises the risk of later sickness absence.
How do I measure presenteeism in a small team? Use questions B9, B10, and B11 from the HPQ on a 0-to-10 scale. Absolute presenteeism equals 10 x B11. Measure every 4 weeks, then compare the team median.
Does an attendance bonus cause presenteeism? It can. The meta-analysis by Miraglia and Johns (2016) found that strict absence rules correlate with more presenteeism. Schnabel (2022) writes that a no-absence bonus can increase absence and long illness later.
Does work from home remove presenteeism? No. Schnabel (2022) describes virtual presenteeism: employees keep working while ill because they feel invisible. Measure remote staff with the same 7 questions.
Next step
The limit still applies: HPQ scores are self-report, and this article is not medical advice or legal advice. If the main trigger in your team is manual work that piles up, use AI Workflow Audit. It maps your workflow and manual workload over 1 to 2 weeks, then gives you a written priority list. Book a 30-minute session if you want to discuss your team scores with us.
Sources
- Johns (2010). "Presenteeism in the workplace: A review and research agenda", Journal of Organizational Behavior 31(4), pp. 519 to 542. The definition of attending work while ill. We read the abstract.
- Hemp (2004). "Presenteeism: At Work, But Out of It", Harvard Business Review, October 2004. The result-based definition, the 150 billion dollar estimate, and the engineer case. We read the abstract and the opening.
- Kessler et al. (2003). Journal of Occupational and Environmental Medicine 45(2), pp. 156 to 174. HPQ calibration in 4 job groups.
- The HPQ scoring memo, Kessler, Petukhova, McInnes, and Üstün, 1 May 2007, updated 8 January 2024. Questions B3 to B11 and the scoring formulas.
- Goetzel et al. (2004). Journal of Occupational and Environmental Medicine 46(4), pp. 398 to 412. 10 conditions, presenteeism 18% to 60% of cost.
- Collins et al. (2005). Journal of Occupational and Environmental Medicine 47(6), pp. 547 to 557. Dow Chemical, 10.7% and 6.8% of labor cost.
- Stewart et al. (2003). JAMA 290(18), pp. 2443 to 2454. 28,902 workers, 76.6% of lost time at work. Depression study: JAMA 289(23), pp. 3135 to 3144, 81% of cost.
- Aronsson et al. (2000). Journal of Epidemiology and Community Health 54(7), pp. 502 to 509. 3,801 Swedish workers, odds ratio 2.29.
- Miraglia and Johns (2016). Journal of Occupational Health Psychology 21(3), pp. 261 to 283. Meta-analysis of 109 samples, 175,965 participants.
- Skagen and Collins (2016). Social Science and Medicine 161, pp. 169 to 177. Review of 12 long-term studies.
- Schnabel (2022). "Presenteeism at the workplace", IZA World of Labor 495, May 2022. EWCS 2015, worker reasons, absence rules, and virtual presenteeism.
- Hassard and Dulal-Arthur (2026). "What do we know about workplace presenteeism?", Enterprise Research Centre, SOTA Review 68, March 2026. 2 definitions and 2 paths of presenteeism.
- Sidharta et al. (2025). Journal of UOEH 47(2), pp. 45 to 54. 590 Indonesian formal sector workers, 26.1%.
- Rasmussen, Sweeny, and Sheehan (2016). Report to the US Chamber of Commerce, Victoria University, September 2016. Table 2: Indonesia 3.18% and 1.37% of GDP.
- PP 36/2021 on Wages, Articles 40 and 41. The amendments in PP 51/2023 and PP 49/2025 do not change these 2 articles.
- Law 27 of 2022 on Personal Data Protection, Article 4. Health data is specific personal data.
We opened all sources on 26 October 2026.