Direct answer: Parkinson's law is the observation that work expands to fill the time available for it. C. Northcote Parkinson wrote it as a satirical essay in The Economist, 19 November 1955. Later research supports part of the claim: tighter deadlines give a faster work pace. For a small business, this means: calculate deadlines from real work hours, put a time limit on meetings, and do not make a budget that must be spent.
Main condition: The law applies to work with a flexible scope, for example design, reports, meetings, and approvals. Limit: The 1955 essay is satire about British bureaucracy, not an experiment. The well-known deadline study by Ariely and Wertenbroch (2002) was retracted by its journal on 2 September 2026. A deadline that is too tight can also fail, because people tend to underestimate work time.
We opened 14 sources on 28 October 2026. The Economist site refused our access, so we read the full text of the 1955 essay through a PDF copy of the essay on cat-v.org. We also read the full text of Goswami and Urminsky (2020), the NBER working paper by Liebman and Mahoney, and Locke and Latham (2002). For the other sources, we read the abstract on APA PsycNet, PubMed, or Crossref. The studio owner named Raka in this article uses dummy data, not client data.
The problem: deadlines, budgets, and meetings that always run out exactly
You give your team 4 weeks to build a client website. The website is ready on the last day of week 4. The next project gets 2 weeks, and that project is ready on the last day of week 2.
The same pattern appears in other places. The monthly ad budget runs out exactly at the end of the month. A meeting that is scheduled for 60 minutes ends at minute 60, although the decision came at minute 20.
Parkinson gave this pattern a name in 1955. For solo founders and small teams, the pattern is expensive. Team time is the largest cost, and each extra day delays the next project.
Long work hours are also not the same as output. The article on presenteeism explains how to measure output, not attendance.
How it works: from a satirical essay to research evidence
This section separates 2 things: what Parkinson wrote, and what later research found.
1. What Parkinson wrote in 1955
The essay opens with this sentence: "work expands so as to fill the time available for its completion". The first example is an elderly lady who uses a full day to send 1 postcard. According to Parkinson, a busy person can do that task in 3 minutes.
Parkinson then names 2 factors that make the number of officials rise. Factor 1: an official wants to add subordinates, not rivals. Factor 2: officials make work for each other.
The essay shows factor 2 with 7 officials who pass 1 document from desk to desk. In the end, the senior official writes the same reply that he could write alone. More people use more time for the same result.
2. Admiralty and Colonial Office staff data
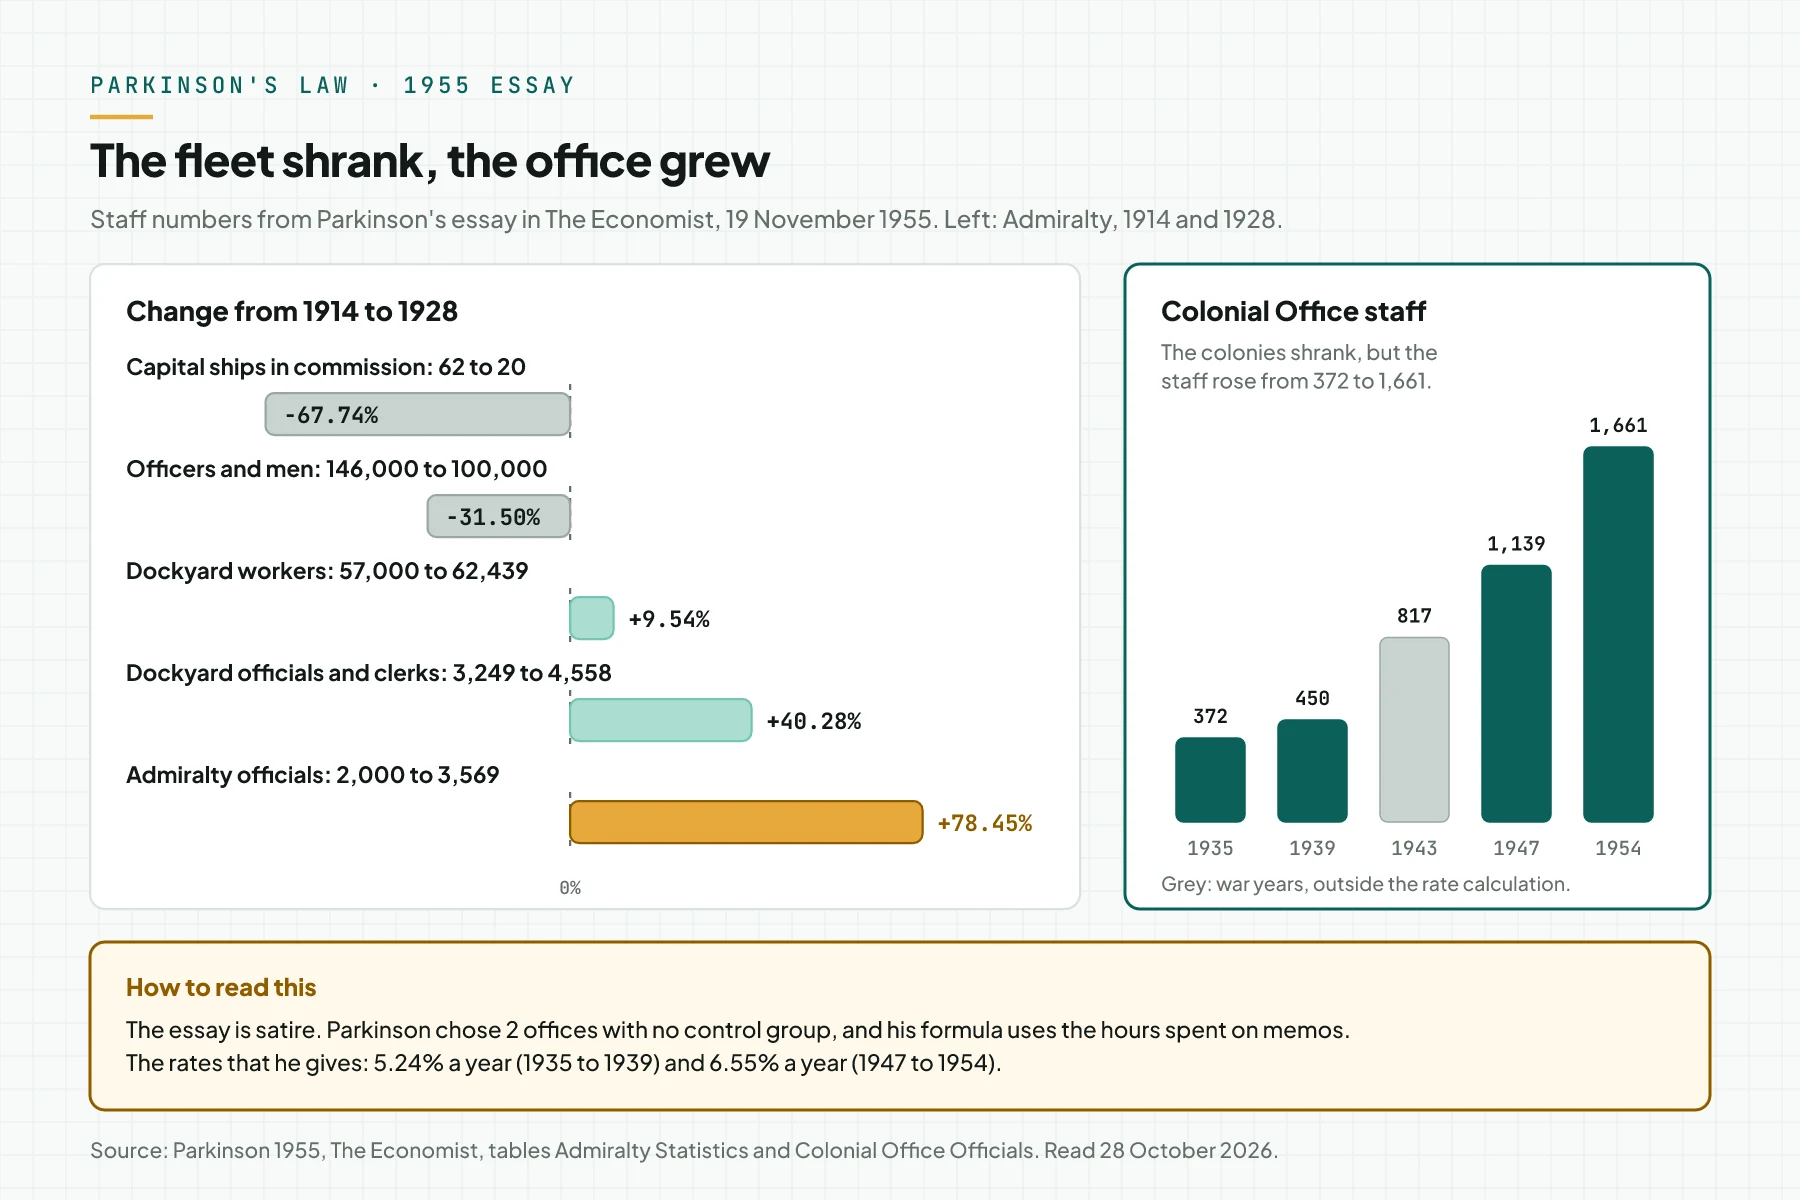
Parkinson used statistics from the Admiralty, the British naval ministry, for 1914 and 1928. In those 14 years, the number of capital ships in commission fell from 62 to 20. The number of Admiralty officials rose from 2,000 to 3,569, or 78.45%.
| Admiralty data | 1914 | 1928 | Change |
|---|---|---|---|
| Capital ships in commission | 62 | 20 | -67.74% |
| Officers and men | 146,000 | 100,000 | -31.50% |
| Dockyard workers | 57,000 | 62,439 | +9.54% |
| Dockyard officials and clerks | 3,249 | 4,558 | +40.28% |
| Admiralty officials | 2,000 | 3,569 | +78.45% |
Parkinson also gave data for the Colonial Office, the British office for its colonies. Its staff rose from 372 people in 1935 to 1,661 people in 1954, although the colonies shrank. According to Parkinson, the peacetime rate of increase was 5.24% a year (1935 to 1939) and 6.55% a year (1947 to 1954).
3. Why the essay is satire, not proof
The essay uses the style of a scientific report to mock its subject. Parkinson writes a formula with variables such as the number of hours spent on internal memos. He then writes that the result of the formula is always 5.17% to 6.56% a year, whatever the amount of work.
The Admiralty data also has no control group. The data shows that office staff rose while the fleet fell, but it does not test the cause. The last sentence of the essay compares the author with a botanist: his task is to measure how fast the weeds grow, not to pull them out.
So the first sentence of the essay is more useful for business than the formula. The research below tests that first sentence.
4. Experiments: extra time makes work take longer
Aronson and Gerard (1966) gave some participants extra time, as if by accident. On a similar task after that, these participants worked longer, although they could choose their own pace. The authors concluded that work which has expanded stays long on the next task.
Bryan and Locke (1967) tested Parkinson's law as a goal-setting effect. We could not open the text of that study. According to the summary in Locke and Latham (2002), tight deadlines give a faster work pace than loose deadlines in the laboratory.
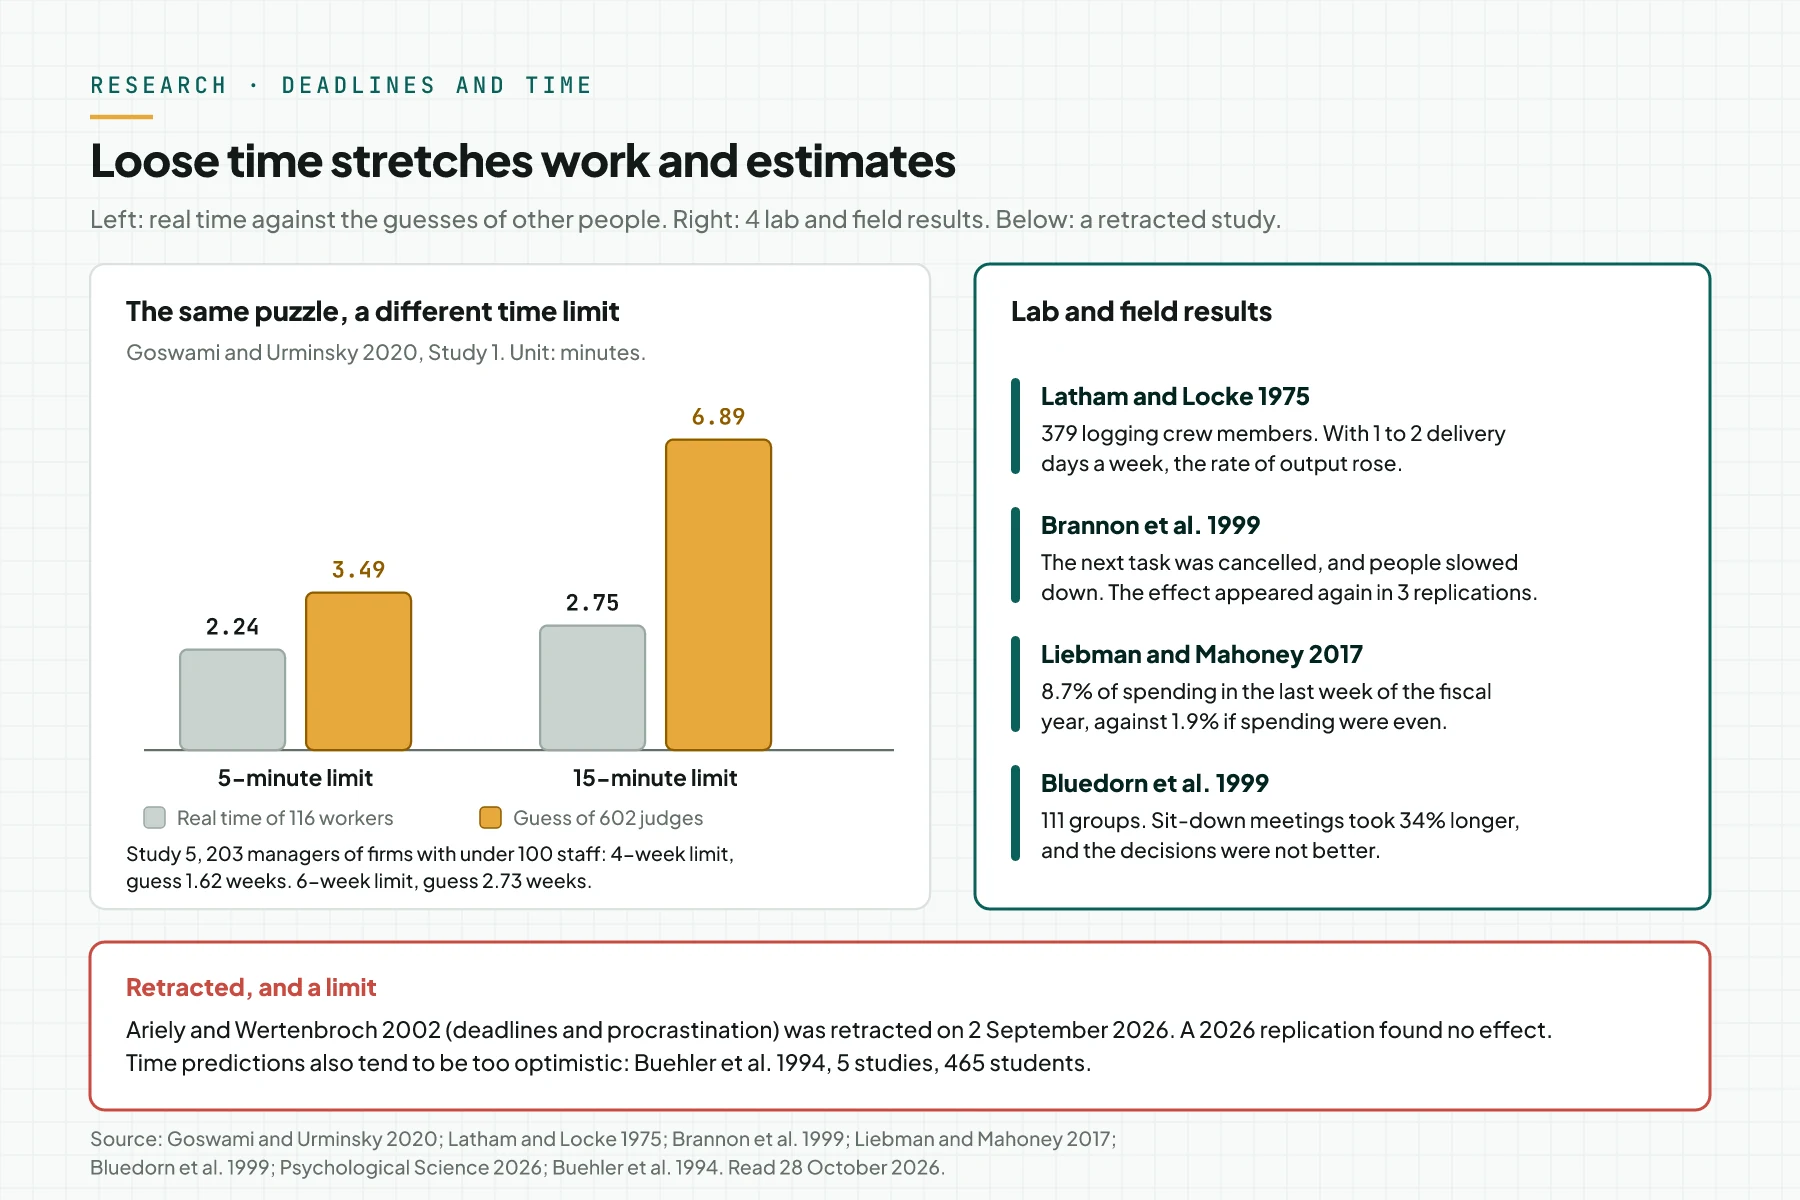
Brannon, Hershberger, and Brock (1999) told some students that the 4th set of face photos was cancelled, before they started the 3rd set. That group slowed down on the 3rd set. The effect appeared again in 2 exact replications and 1 conceptual replication.
5. In the field: 379 logging crew members
Latham and Locke (1975) tested the same idea in the field. The wood mills accepted deliveries on only 1 or 2 days a week. In those weeks, 379 logging crew members had a higher rate of output than in weeks with no limit.
There is 1 important note. The owners and the crews were paid per unit of wood, so they had an incentive to push output when delivery days were limited. A team on a monthly salary can react differently.
6. Managers also stretch their estimates
Goswami and Urminsky (2020) found another side of Parkinson's law. In Study 1, 116 participants solved a digital puzzle with a limit of 5 minutes, 15 minutes, or no limit. Their real times were almost the same: 2.24 minutes, 2.75 minutes, and 2.23 minutes. The difference was not statistically significant.
Then 602 online judges guessed the work time of those participants. The judges guessed 3.49 minutes for the 5-minute limit and 6.89 minutes for the 15-minute limit. So a long time limit makes people think the work is larger.
Study 5 tested 203 managers of firms with fewer than 100 staff. When the limit of a marketing project rose from 4 to 6 weeks, the estimate of the vendor's work time rose from 1.62 to 2.73 weeks. The estimate of the number of letters that the vendor sends also rose, from about 12,000 to 17,000. The authors call this pattern a scope perception bias.
7. Budgets: spending piles up in the last week
Parkinson's law also appears with money. Liebman and Mahoney (2017) studied almost all US federal procurement data from 2004 to 2009. That budget expires if it is not used by the end of the fiscal year.
The result: 8.7% of spending fell in the last week of the fiscal year. If spending were even, the share per week would be 1.9%. So last-week spending was 4.9 times the average of other weeks.
Quality also fell. IT projects that started in the last week had 2.2 to 5.6 times higher odds of a lower quality score. The US Department of Justice may carry unused IT budget into the next year. There, only 3.4% of IT spending fell in the last week, against 9.3% for non-IT spending.
This data comes from the US government, not from small firms. The pattern still applies to ad budgets or team budgets that must be spent each month.
8. Meetings: less time, the same decisions
Bluedorn, Turban, and Love (1999) compared 56 groups of 5 people who met standing up with 55 groups who met sitting down. Sit-down meetings took 34% longer. Their decisions were not better.
People in sit-down meetings were more satisfied with the meeting. The participants in this study were students. So the study supports a time limit on meetings, but it does not prove that all meetings must be held standing.
9. Limits of the evidence: the Ariely deadline study was retracted
Many productivity articles cite Ariely and Wertenbroch (2002) as proof that staged deadlines beat procrastination. Psychological Science retracted that article on 2 September 2026, according to the retraction notice.
In Study 2, the article reported 136.1 corrections for participants with evenly spaced deadlines, against 71.1 for participants with 1 deadline on the last day. Data Colada post 138 found that 18 of 20 participants in the last-day group had a twin with identical correction counts. In post 139, they found 13 grades in Study 1 that differed from a recalculation, and 12 of them favoured the hypothesis.
Hyndman and Bisin (2026) repeated Study 2 and found that changes in the deadlines had a negligible effect. According to Retraction Watch, Wertenbroch himself asked for the retraction on 23 July 2026. So do not use that study as evidence, also not in your team presentations.
A second limit comes from the other direction. Buehler, Griffin, and Ross (1994) tested 465 students in 5 studies. Their predictions of completion time were too optimistic. The bias disappeared when participants connected their predictions to past experience.
So a deadline that is too loose makes work expand, and a deadline that is too tight makes the schedule slip. Rama Digital recommendation: calculate deadlines from the real work hours of similar jobs, not from a feeling or from an empty calendar.
Compared: 4 tools against Parkinson's law
The research above gives 4 tools. The table separates the tool, the target, the evidence, and the risk.
| Tool | What you do | Target | Evidence | Risk |
|---|---|---|---|---|
| A deadline from real hours | Measure the work hours of 3 similar jobs, then add a buffer. | Projects and routine tasks | Bryan and Locke (1967), Latham and Locke (1975), Buehler et al. (1994) | Old work hours were not recorded |
| Staged checkpoints | Split 1 large deadline into 3 to 4 interim outputs. | Projects longer than 1 week | No strong evidence yet. The Ariely and Wertenbroch (2002) study was retracted. | Report load when there are too many checkpoints |
| A meeting time limit | Schedule 30 minutes with an agenda and 1 decision owner. | Routine meetings | Bluedorn et al. (1999) | Attendees feel less satisfied |
| A budget that does not expire | Let unused budget move to the next period, with a cost limit per result. | Ads, purchases, and team budgets | Liebman and Mahoney (2017) | Unused budget piles up with no plan |
Tools 1, 3, and 4 have direct evidence. Tool 2 has no strong evidence after the 2026 retraction, so measure the result in your own team. The 5 steps below use all 4 tools.
Before you start: prepare 5 things
- 1 type of work that repeats, for example a website project, a monthly report, or weekly content.
- Time records of the last 3 similar jobs: start date, finish date, and work hours if you have them.
- The team meeting calendar for the last 2 weeks.
- Budget reports for the last 3 months, for example daily ad spending.
- 1 empty spreadsheet.
If you have no work hour records, start to record them this week. Until then, use chat history, file history, or invoices as a temporary source.
Step 1: Measure the real time of 3 similar jobs
Open a spreadsheet. Put the last 3 similar jobs in 1 table: the deadline, the day the job finished, and the recorded work hours. Calculate the average work hours and the highest work hours.
This step uses the result of Buehler, Griffin, and Ross (1994): the optimistic bias disappears when people connect their predictions to past experience. If jobs always finish exactly on the deadline day, Parkinson's law is probably at work. Check: the table has 3 jobs, and each row has a number of work hours.
Step 2: Write the definition of done before you set a deadline
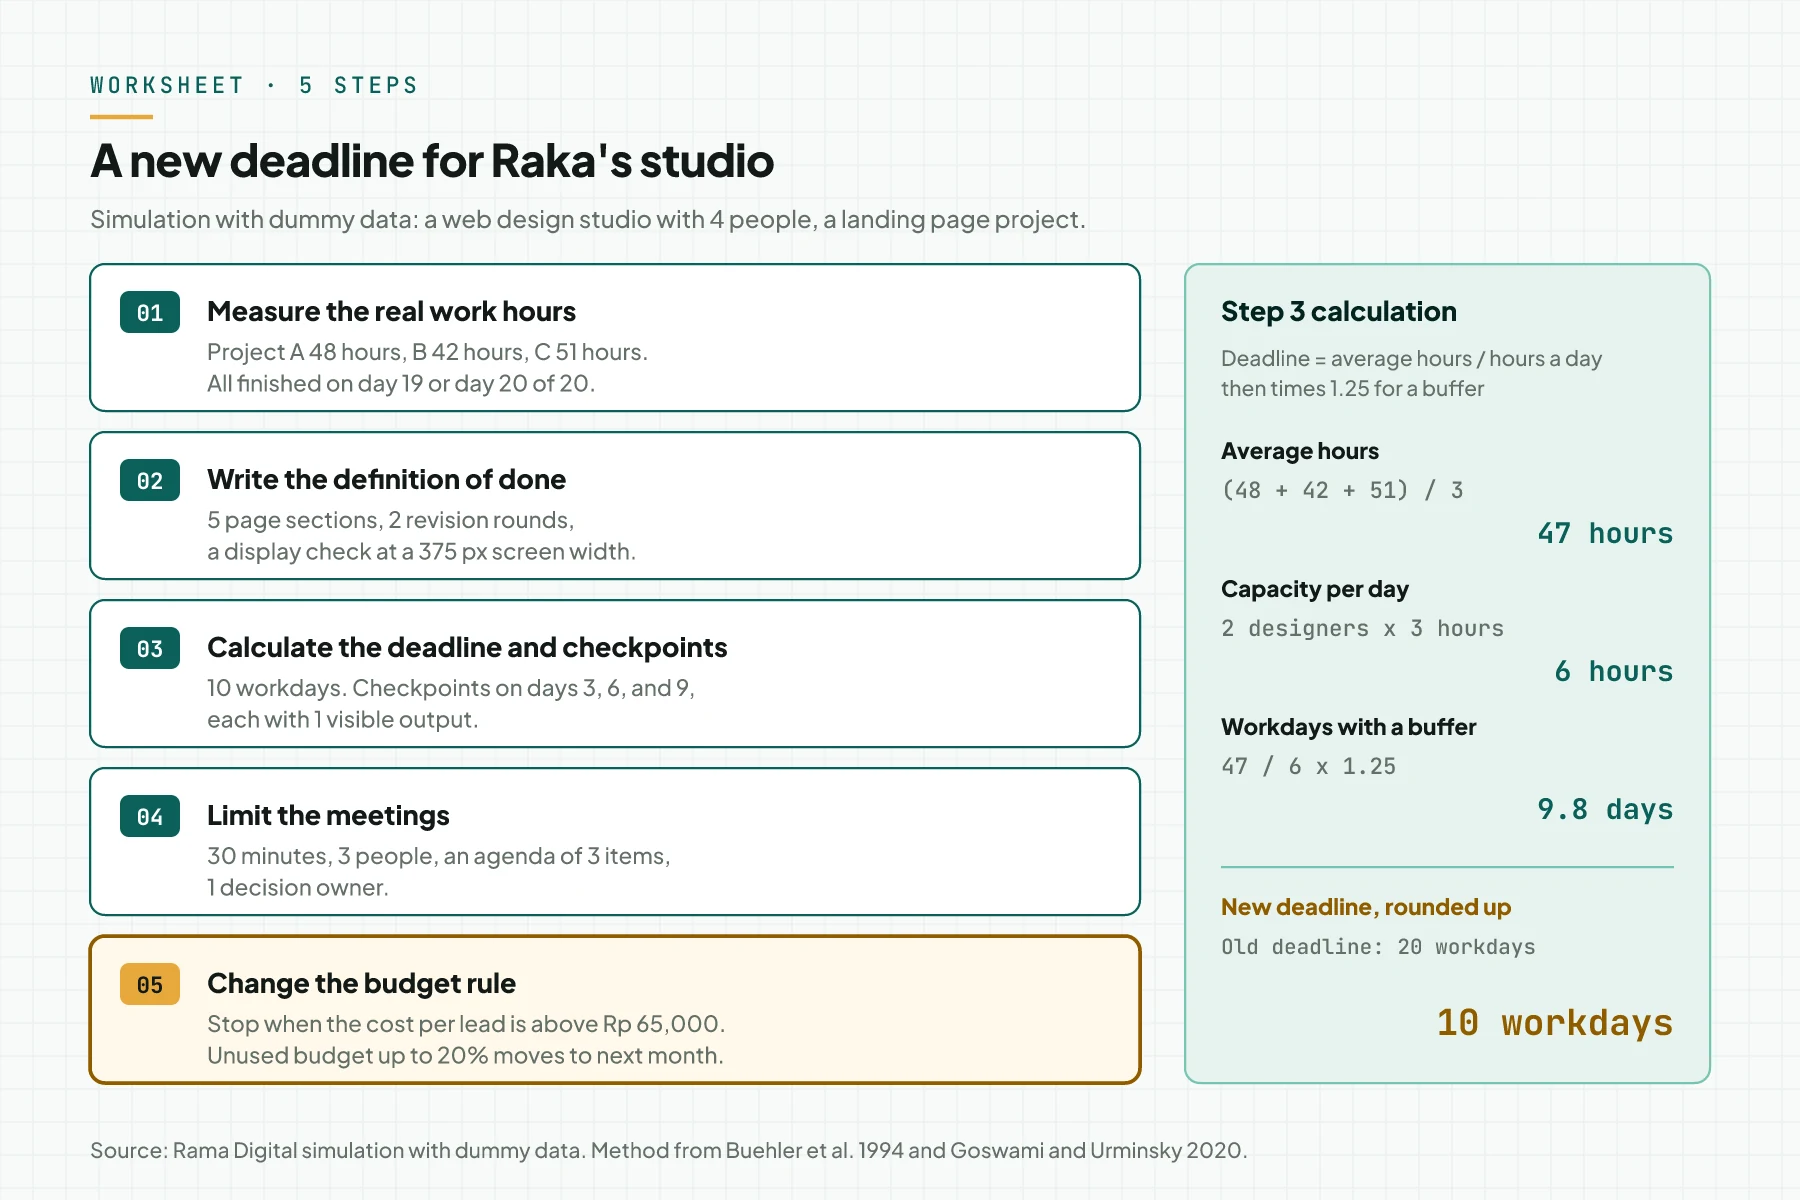
Write the definition of done on 1 page: the list of outputs, the number of revision rounds, and how you check quality. Example: 5 page sections, 2 revision rounds, and a display check at a screen width of 375 px.
Goswami and Urminsky (2020) found that a long deadline makes people think the scope of work is larger. A definition of done keeps the scope the same. Check: the client or your manager approves the definition of done before you write the deadline.
Step 3: Calculate the deadline and split it into checkpoints
Calculate the deadline with this formula: average work hours divided by the work hours per day for that job, then times 1.25 for a buffer. Round up. Make sure that the result also covers the longest job from step 1.
Then split the deadline into 3 to 4 checkpoints. Each checkpoint has 1 visible output, for example a wireframe, a design, or a page on a test server. Rama Digital recommendation: use a 25% buffer for work that you did before, and 50% for new work. Check: each checkpoint has a date, an owner, and 1 output.
Step 4: Put a time limit and an agenda on each meeting
Change the default length of routine meetings from 60 minutes to 30 minutes. Write an agenda of no more than 3 items in the invitation. Also write the name of 1 person who owns the decision.
Bluedorn et al. (1999) found that sit-down meetings took 34% longer with no better decisions. Parkinson's factor 2 also applies here: each extra attendee can make work for the other attendees. So invite only the people who give data or make the decision. Check: each meeting invitation has a length, an agenda, and a decision owner.
Step 5: Change budgets that must be spent
Find the budgets that always run out exactly at the end of a period, for example a monthly ad budget. Replace the rule "spend it all" with 2 rules: a cost limit per result, and unused budget that can move to the next period.
Liebman and Mahoney (2017) found that permission to carry over unused budget reduces the year-end spending spike. Rama Digital recommendation: let up to 20% of unused budget move to the next month, and write the stop line before the month starts. This is the same principle as the stop line in the article on the sunk cost fallacy. Check: the budget rule has 1 cost limit per result and 1 limit on the amount that can move.
Simulation: Raka and a studio of 4 people
This example uses dummy data. Raka runs a web design studio with 4 people. Each landing pageLanding pageThe page an ad points to. It carries 1 offer and 1 action, with no menu pulling the visitor elsewhere.What is a landing page? project always gets a deadline of 20 workdays.
The first table shows the last 3 projects.
| Project (simulation) | Deadline | Finished on | Recorded work hours |
|---|---|---|---|
| A, August | 20 workdays | Day 20 | 48 hours |
| B, September | 20 workdays | Day 19 | 42 hours |
| C, October | 20 workdays | Day 20 | 51 hours |
The average is 141 hours divided by 3, which is 47 hours. 2 designers each give 3 hours a day to this project, so the capacity is 6 hours a day. 47 divided by 6 equals 7.8 workdays. With a 25% buffer, the result is 9.8 days, rounded up to 10 workdays. This number also covers the longest project, which took 51 hours or 8.5 days.
The second table compares 3 areas before and after the new rules.
| Area | Old rule | New rule (November simulation) |
|---|---|---|
| Landing page project | Deadline 20 workdays, 47 work hours on average | Deadline 10 workdays, 45 work hours |
| Routine meetings | 3 meetings x 60 minutes x 4 people = 12 person-hours a week | 3 meetings x 30 minutes x 3 people = 4.5 person-hours a week |
| Ad budget Rp 6,000,000 | Must be spent. 99 leads, cost per lead Rp 60,606 | Cost limit per lead Rp 65,000. Rp 5,040,000 spent, 90 leads, cost per lead Rp 56,000 |
| Date (simulation) | Event | What is recorded | Decision |
|---|---|---|---|
| 2 Nov | Raka opens the hour logs of the last 3 projects. | Deadline 20 workdays, finished on day 19 or 20, 47 hours on average. | Calculate a new deadline. |
| 3 Nov | Raka writes the definition of done for project D. | 5 page sections, 2 revision rounds, a 375 px screen check. Deadline 10 workdays, 3 checkpoints. | Send the schedule to the client. |
| 4 Nov | Raka changes the routine meetings and the ad rule. Project D starts. | 30-minute meetings, 3 people, an agenda of 3 items. Cost limit per lead Rp 65,000. | Apply the rules. |
| 11 Nov | Checkpoint 2: design. | The client approves the design on time. 24 work hours used. | Go on to the build stage. |
| 17 Nov | Project D is handed over on workday 10. | 45 work hours recorded. 2 revision rounds. | Use a 10-day deadline for the next project. |
| 30 Nov | Raka checks the ad budget. | Rp 5,040,000 spent, 90 leads. Rp 960,000 left. | Move the rest to December. |
In this simulation, the project work hours stay almost the same: 47 hours against 45 hours. Calendar time falls from 20 to 10 workdays, so the team can start the next project 10 days earlier. These numbers are an example, and your business result can differ.
The ad budget shows the same pattern as the Liebman and Mahoney data. Under the old rule, the last 9 leads cost Rp 960,000, or Rp 106,667 per lead. Raka chose to keep that money for the next month.
Checklist for the first 4 weeks
- Record the real work hours of the last 3 similar jobs. Owner: project manager. Evidence: a table of work hours.
- Write the definition of done before the deadline. Owner: project owner. Evidence: a 1-page document that the client approves.
- Calculate the deadline from real hours with a 25% buffer. Owner: project manager. Evidence: the formula in the spreadsheet.
- Set 3 to 4 checkpoints with 1 output at each point. Owner: project manager. Evidence: a list of dates and outputs.
- Change routine meetings to 30 minutes with an agenda and a decision owner. Owner: the person who sends the invitation. Evidence: the calendar invitation.
- Replace budgets that must be spent with a cost limit per result and a carry-over limit. Owner: business owner. Evidence: a written budget rule.
- Compare work hours, calendar time, and quality after 4 weeks. Owner: you. Evidence: a before and after table.
- Go back to the old deadline if 2 checkpoints in a row are more than 1 workday late, or if the client asks for more than 2 revision rounds. Owner: project manager. Evidence: a dated decision note.
When a short deadline does harm
A short deadline fits work with a clear scope and past time data. A short deadline fits less well for research, new creative work, or work with safety or legal risk.
Warning signs: the team starts to work overtime, client revisions rise, or quality falls. When that happens, give the buffer back. Do not add work hours. For the decision to extend or shorten a deadline, write it as the case of another founder. The article on Solomon's paradox explains how.
Parkinson's law is also not a reason to cut staff without data. The 1955 essay mocks the growth of bureaucracy, but it does not measure the real workload.
Frequently asked questions
What is Parkinson's law? Parkinson's law is the observation that work expands to fill the time available for it. C. Northcote Parkinson wrote it in a satirical essay in The Economist on 19 November 1955.
Who was C. Northcote Parkinson? C. Northcote Parkinson was a historian. When the essay appeared, he was Raffles Professor of History at the University of Singapore, according to the author note on the copy of the essay.
Is Parkinson's law proven? In part. Experiments and field studies found that loose deadlines make work take longer or go slower. The formula and the staff data in the 1955 essay are satire, not a scientific test.
Can I still use the Dan Ariely deadline study? No. Psychological Science retracted the Ariely and Wertenbroch (2002) study on 2 September 2026. A 2026 replication did not find the deadline effect that the study reported.
What is the difference between Parkinson's law and the planning fallacy? Parkinson's law describes work that expands when time is loose. The planning fallacy describes time predictions that are too optimistic. Both make deadlines from a feeling inaccurate, so calculate deadlines from past work hour data.
How long should a meeting be? Research does not give 1 number yet. Bluedorn et al. (1999) found that sit-down meetings took 34% longer with no better decisions. Rama Digital recommendation: start with 30 minutes and an agenda of 3 items, then measure the number of decisions per meeting.
Next step
The limit still applies: Parkinson's essay is satire, and the Ariely deadline study was retracted. If deadlines and meetings in your team often expand because of manual workflows, use AI Workflow Audit. The service maps your workflows and bottlenecks in 1 to 2 weeks, then gives you a written priority list. Book a 30-minute session if you want to discuss 1 project with us first.
Sources
- C. Northcote Parkinson, "Parkinson's Law", The Economist, 19 November 1955. We read the full text through a PDF copy of the essay on cat-v.org, 5 pages.
- Aronson and Gerard (1966). "Beyond Parkinson's law: The effect of excess time on subsequent performance", Journal of Personality and Social Psychology 3(3), pp. 336 to 339. We read the abstract.
- Bryan and Locke (1967). "Parkinson's law as a goal-setting phenomenon", Organizational Behavior and Human Performance 2(3), pp. 258 to 275. We could not open the text or the abstract.
- Latham and Locke (1975). "Increasing productivity and decreasing time limits: A field replication of Parkinson's law", Journal of Applied Psychology 60(4), pp. 524 to 526. 379 crew members. We read the abstract.
- Locke and Latham (2002). "Building a practically useful theory of goal setting and task motivation", American Psychologist 57(9), pp. 705 to 717. We read the full text.
- Brannon, Hershberger, and Brock (1999). "Timeless demonstrations of Parkinson's first law", Psychonomic Bulletin and Review 6(1), pp. 148 to 156. We read the abstract.
- Goswami and Urminsky (2020). "More time, more work: How time limits bias estimates of task scope and project duration", Judgment and Decision Making 15(6), pp. 994 to 1008. We read the full text.
- Liebman and Mahoney (2017). "Do Expiring Budgets Lead to Wasteful Year-End Spending? Evidence from Federal Procurement", American Economic Review 107(11), pp. 3510 to 3549. We read the full text of the NBER working paper 19481, revised January 2018.
- Bluedorn, Turban, and Love (1999). "The effects of stand-up and sit-down meeting formats on meeting outcomes", Journal of Applied Psychology 84(2), pp. 277 to 285. 111 groups. We read the abstract.
- Buehler, Griffin, and Ross (1994). "Exploring the planning fallacy: Why people underestimate their task completion times", Journal of Personality and Social Psychology 67(3), pp. 366 to 381. 5 studies, 465 students. We read the abstract.
- Ariely and Wertenbroch (2002). "Procrastination, Deadlines, and Performance: Self-Control by Precommitment", Psychological Science 13(3), pp. 219 to 224. Retracted, see the retraction notice in Psychological Science 37(9), p. 665, 2 September 2026.
- Hyndman and Bisin (2026). "Replication of Procrastination, Deadlines, and Performance: Self-Control by Precommitment", Psychological Science 37(8), pp. 557 to 571. We read the abstract.
- Data Colada post 138, 31 August 2026, and post 139, 2 September 2026. Data analysis of Study 2 and Study 1 of Ariely and Wertenbroch (2002).
- Retraction Watch, 3 September 2026. Timeline of the retraction and statements by the authors.
We opened all sources on 28 October 2026.