Direct answer: Survivorship bias is the error of drawing a conclusion only from what survived, because the failures are already gone from the data. Founder success stories, testimonials, and competitor ads that still run are survivor data. Before you copy, find the denominator: how many tried, how many failed, and what the difference between them is.
Main condition: The bias appears when a process filters the data before the data reaches you. Examples of that process are businesses that close, buyers who leave, and ads that are stopped. Limit: The bias does not make a success story false. It makes a success story weak as evidence. The viral picture of a plane with red dots is also not a picture from the memos of Abraham Wald.
We opened 10 sources on 29 October 2026. We read the full text of the CNA reprint of the Wald memos (CRC 432, July 1980), a PDF of 100 pages. We read BLS Table 7 for 3 groups of business sites, with data to March 2026. For Mangel and Samaniego (1984), Brown et al. (1992), Carhart et al. (2002), and Denrell (2003), we read the abstract, because the publisher sites use a bot check. Sari in this article uses dummy data, not client data.
The problem: you copy what you can see, not what works
A founder tells a story on a podcast. The founder opened 3 branches in 12 months with a large loan, and the business succeeded. You hear the story and start to calculate a loan for your own branch.
The story is real. The problem is that founders who used the same method and closed do not get a podcast invitation. They do not write books, and their accounts are quiet. So you hear only 1 side of the group that tried.
The same pattern appears in other places. You see 40 testimonials on the account of a competitor, but you do not see the buyers who asked for a refund. You see a competitor ad that has run for 60 days, but you do not see the ads that the competitor stopped.
An ad that still runs does not always make money. A competitor can keep paying for an ad because a lot of money is already spent. The article on the sunk cost fallacy explains that trap.
How it works: from the 1943 Wald memos to business data
This section separates 3 things: what Wald wrote, what other people added later, and what business research found.
1. Wald's data: the planes that came back, not the planes that fell
Abraham Wald worked in the Statistical Research Group at Columbia University during World War II. In 1943, that group issued 8 memos by Wald for the National Defense Research Committee. The title was "A Method of Estimating Plane Vulnerability Based on Damage of Survivors".
Wald's problem was incomplete data. The air forces knew the number of planes that went out. They also knew the number of hits on each plane that came back. They could not examine the planes that fell.
Wald wrote formulas to estimate the chance that a plane falls, from the data of the surviving planes only. According to the CNA catalog page, the work was never published outside. The method was still used on data from the Korean War and the Vietnam War. The Center for Naval Analyses (CNA) reprinted the memos in July 1980.
2. Wald's example: 400 planes, 359 came back
Memo 5 gives a hypothetical example. 400 planes went out, and 359 came back. Of those 359 planes, 240 had no hits, 68 had 1 hit, 29 had 2 hits, 12 had 3 hits, and 10 had 4 hits. The total was 202 hits.
Wald then divided the plane into 4 parts. Wald assumed that the chance that a hit lands on a part is equal to the share of area of that part. So if no hit were dangerous, the engines, with 26.9% of the area, would carry about 26.9% of the hits.
| Part of the plane | Share of area | Hits on the planes that came back | Chance to fall from 1 hit |
|---|---|---|---|
| Engines (2) | 35 of 130 square feet, 26.9% | 39 of 202, 19.3% | 39% |
| Fuselage | 45 of 130 square feet, 34.6% | 78 of 202, 38.6% | 5% |
| Fuel system | 20 of 130 square feet, 15.4% | 31 of 202, 15.4% | 15% |
| Other parts | 30 of 130 square feet, 23.1% | 54 of 202, 26.7% | 2% |
| Whole plane | 130 square feet | 202 hits on 359 planes | 15% |
On the planes that came back, the engines carried only 19.3% of the hits. The missing engine hits are on the planes that did not come back. Wald calculated that 1 hit on an engine downs the plane 39% of the time, against 5% for the fuselage.
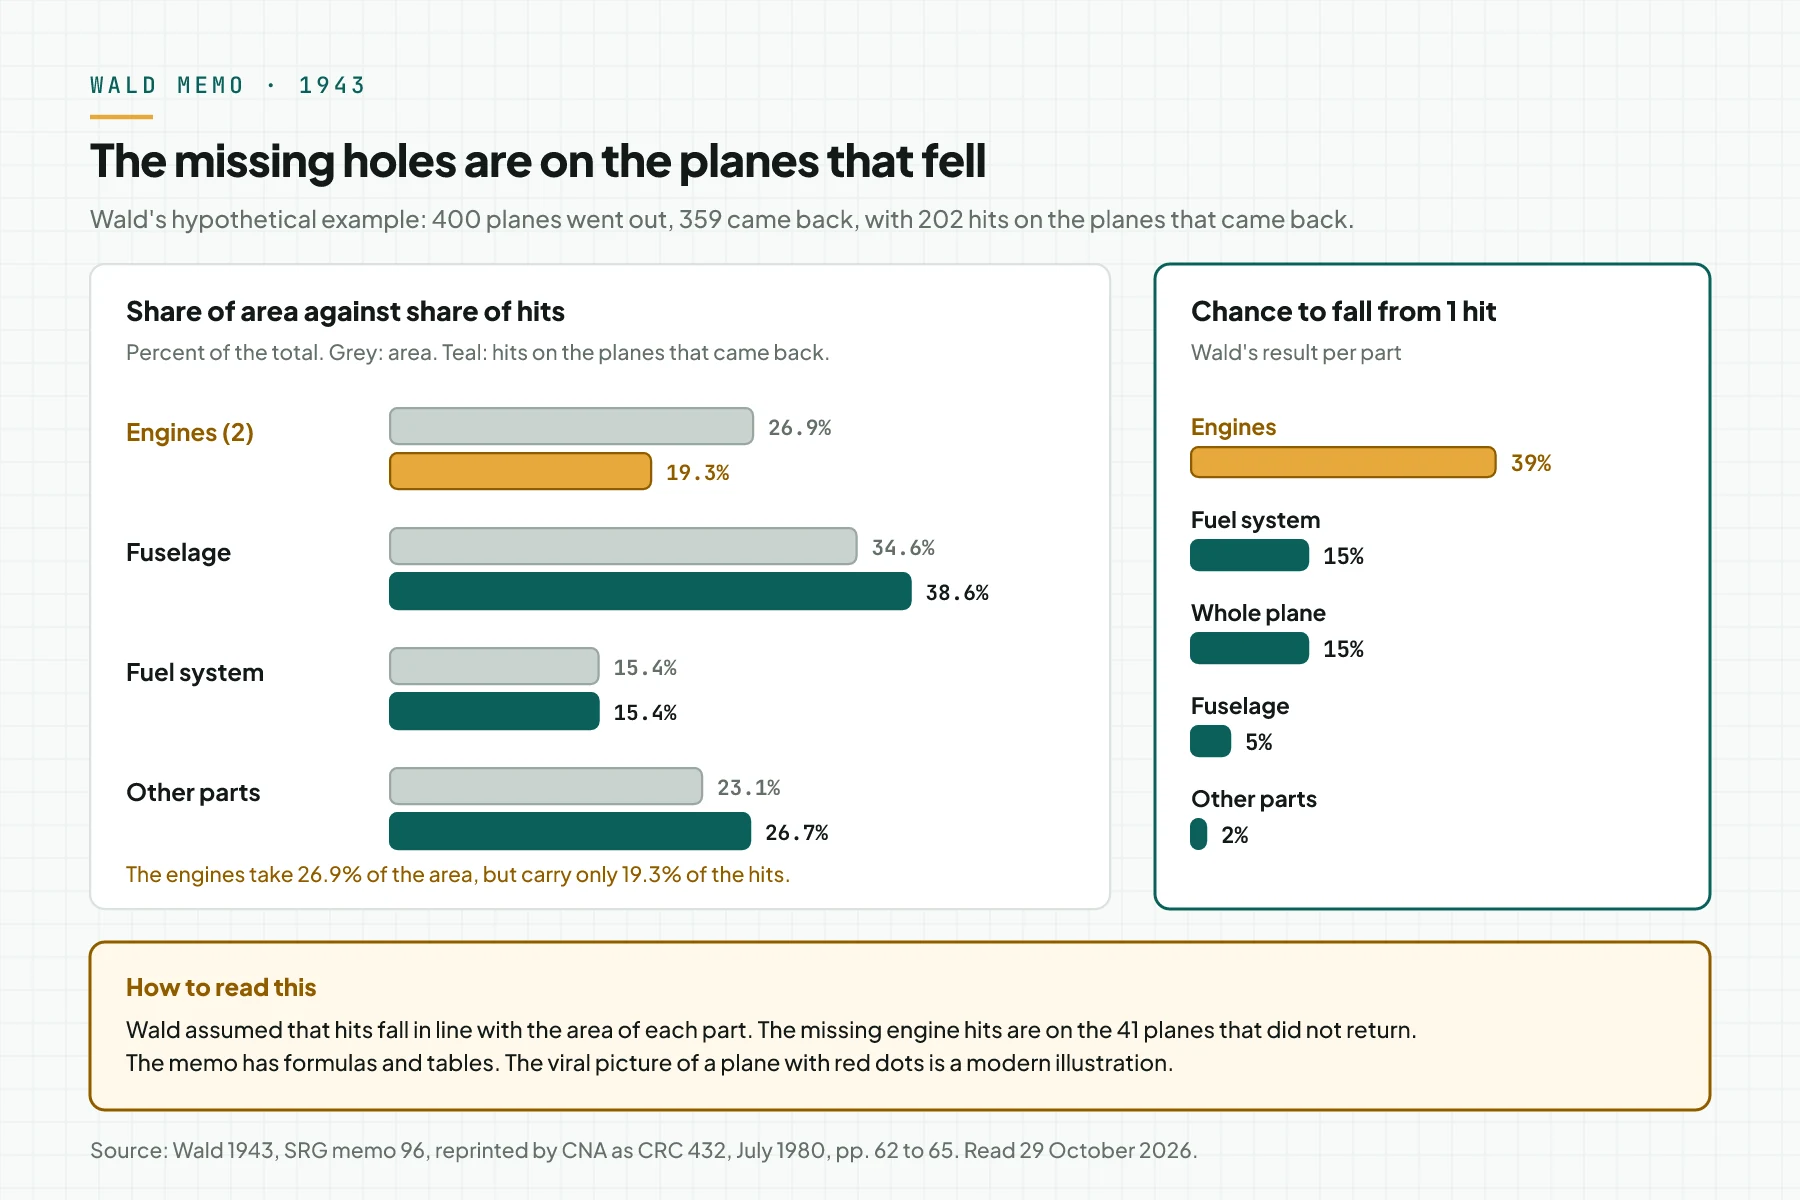
Memo 8 uses more detailed hypothetical data, with types of bullets and parts of the plane. According to Wald, tables like that "can be used as guides for locating protective armor". So the lesson is not "protect the parts with no holes". The lesson is: compare the survivor data with the data that you expect from the whole group.
3. The plane with red dots is not Wald's picture
A picture of a grey plane with red dots often comes with this story. In our reading, the PDF of the Wald memos contains text, formulas, and tables. We did not find a picture of a plane in those 100 pages.
According to its file page on Wikimedia Commons, the picture is an illustration of a hypothetical damage pattern. Its description names a Wald report with no illustration, a picture concept by Cameron Moll (2005), a new version by McGeddon (2016), and a vector file by Martin Grandjean (2021). So the picture is useful for teaching, but it is not war data.
Mangel and Samaniego (1984) wrote a summary and an explanation of the Wald memos in the Journal of the American Statistical Association. According to the abstract, Wald's method was used in World War II, the Korean War, and the Vietnam War. We could not open the full text.
4. Investment funds: only living funds enter the data
Brown, Goetzmann, Ibbotson, and Ross (1992) tested the claim that the past performance of investment funds can predict their next performance. According to the abstract, data that holds only the funds that survived can make performance look predictable. Their numerical examples show that this effect can explain the published evidence for prediction.
Carhart, Carpenter, Lynch, and Musto (2002) measured the bias. When the data drops the funds that closed, the average performance looks 0.07% a year higher in 1-year samples. In samples longer than 15 years, the bias rises to 1% a year.
For a business owner, this means: a list of "top agencies" or "top sellers" that holds only the ones still alive makes the old winners look like they always win. Longer data makes that bias larger, not smaller.
5. New businesses: about 1 in 3 survive 10 years
Table 7 of the BLS Business Employment Dynamics data follows each group of private US business sites from the year they open. BLS counts the age from the first date that a site reports employees, according to the BLS FAQ. The data measures business sites, so a new branch of 1 firm counts as 1 new business site.
| Group of new US business sites | Number opened | Still open after 1 year | After 5 years | After 10 years |
|---|---|---|---|---|
| All private sectors, opened in the year to March 2016 | 732,856 | 79.6% | 50.7% | 34.2% |
| All private sectors, opened in the year to March 2021 | 839,297 | 79.1% | 47.2% | no data yet |
| Accommodation and food services, opened in the year to March 2016 | 48,681 | 90.3% | 59.6% | 42.9% |
| Professional, scientific, and technical services, opened in the year to March 2016 | 99,171 | 81.8% | 52.4% | 34.4% |
Of the 732,856 business sites that opened in the year to March 2016, 50.7% were still open after 5 years. After 10 years, the number was 34.2%. The sectors accommodation and food services and professional, scientific, and technical services have their own curves, but the pattern is the same: the group gets smaller each year.
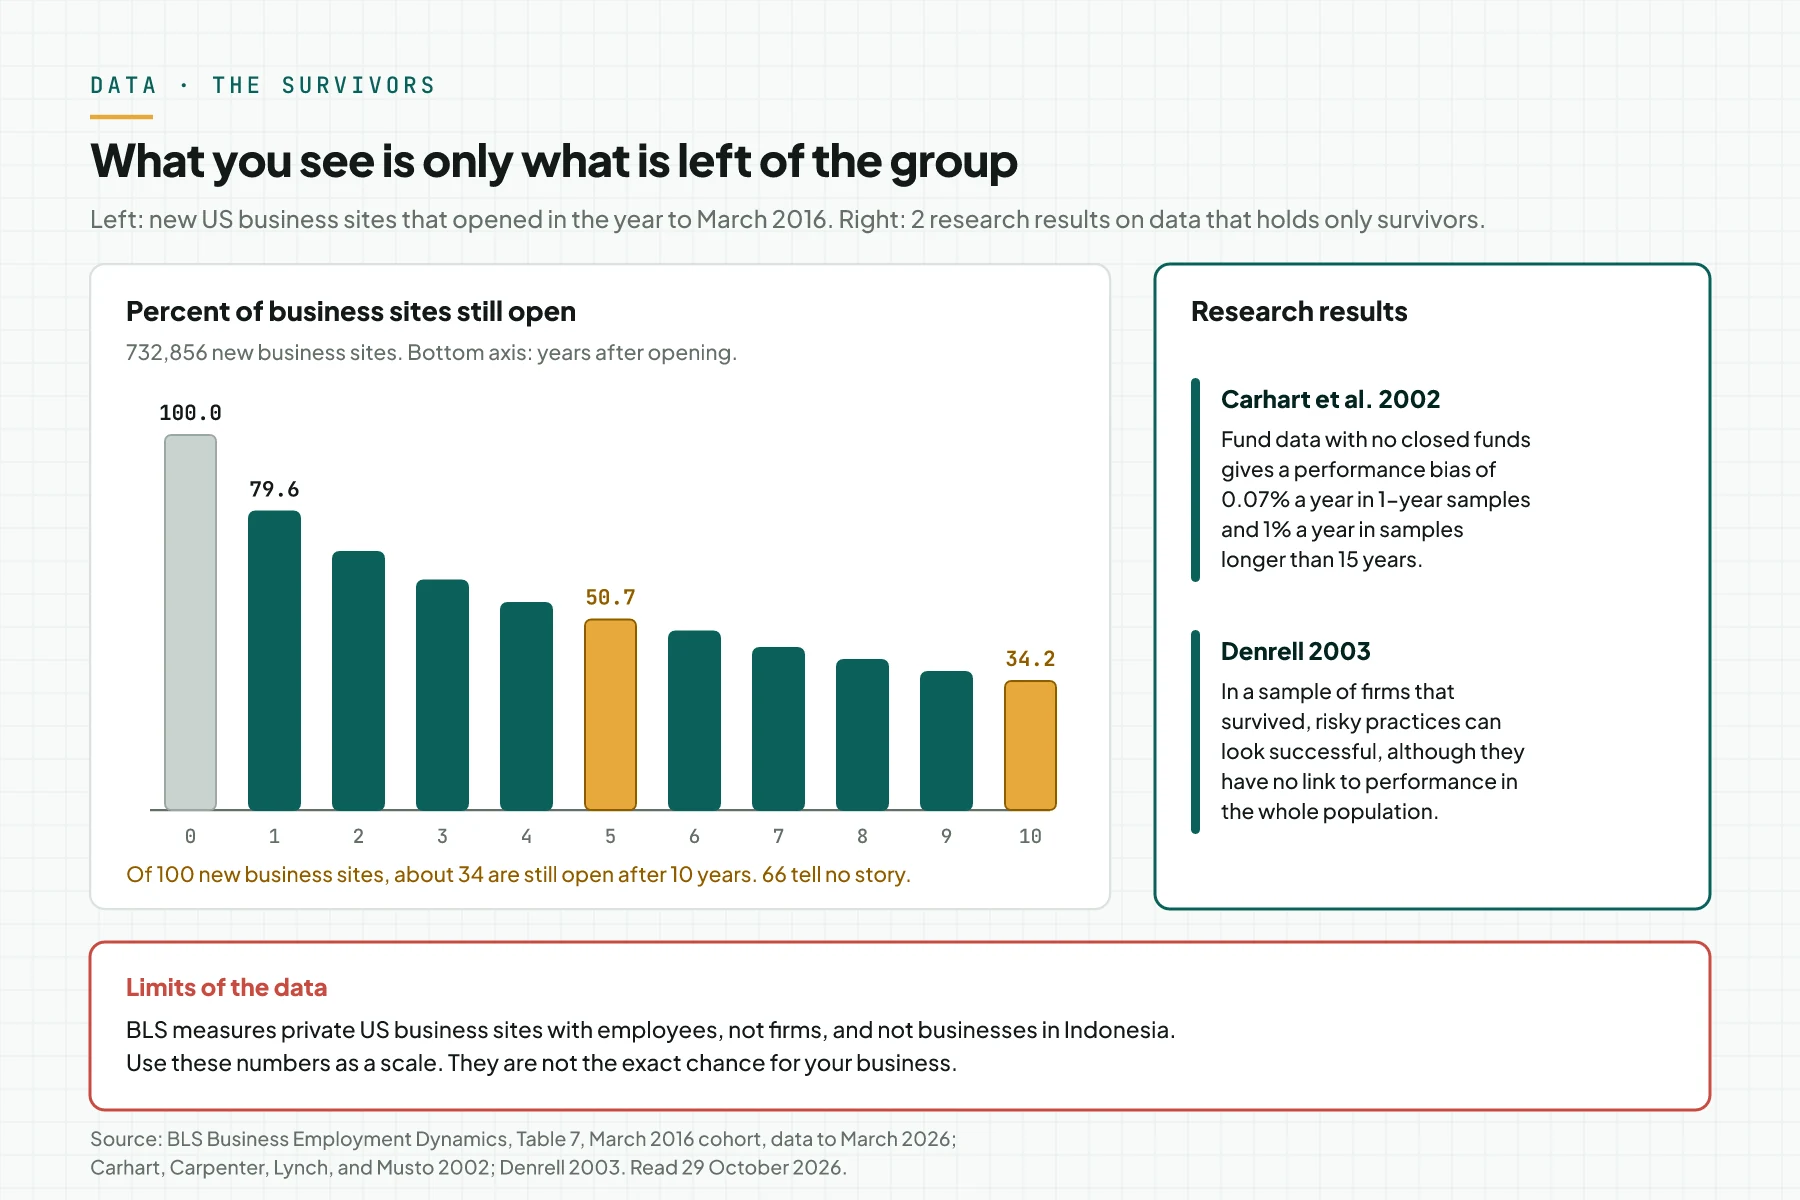
So a 10-year success story comes from about 1 in 3 of the businesses that started. The other 2 in 3 tell no story. This data comes from the US, so use the numbers as a scale, not as the exact chance for a business in Indonesia.
6. Management: risky practices look good among survivors
Denrell (2003) explains how this bias affects business advice. The organizations that you can observe are what is left after a selection process. Books and the business press also tend to choose successful organizations.
As a result, risky practices can look linked to success in a sample of survivors. This can happen although the practice has no link to performance in the whole population. Examples are a large loan, fast expansion, or all the money on 1 channel.
The reason is simple. A risky practice gives a wide range of results: some businesses go up high, and some fall. The ones that fall leave the sample. The ones that go up high become success stories.
7. Limits of the evidence
Wald's example is hypothetical data with assumptions that Wald wrote in the memo. The abstracts of Brown et al. and Carhart et al. are about US investment funds, not small businesses. The BLS data comes from the US and counts only business sites with employees.
Rama Digital recommendation: use a success story as an idea to test, not as evidence. Test that idea with a denominator, the failure data, and a small test in your own business.
Compared: 5 sources of evidence that filter out failure
This table lists 5 sources of evidence that business owners often copy. Each row gives what is missing, 1 check question, and replacement data.
| Evidence that you see | What is out of view | Check question | Replacement data |
|---|---|---|---|
| A founder success story on a podcast, in a book, or at a seminar | Founders who used the same method and closed | How many businesses tried this method, and how many are still open? | A list of similar businesses in your city, the Permanently closed label on Google Maps, community groups |
| Testimonials from the customers of a competitor | Buyers who were unhappy, asked for a refund, or stayed quiet | What percent of buyers give a testimonial? | Order, refund, and repeat order data in your own business |
| Competitor ads that still run | Ads that the competitor stopped | Does this ad run because it makes money, or because the competitor has not stopped yet? | A small test with a limit on the cost per order |
| Case studies from an agency or a vendor | Clients with average or failed results | How many clients in total, and how many are in the case studies? | Ask 2 clients who are not on the case study page |
| Reviews and chats in your own business | Customers who did not order again and leads who did not reply | What do the people who left say? | 1 short question to the customers who left |
For competitor ads, there is 1 more limit. According to the Meta Ad Library tools page, the Ad Library shows all active ads. Ads about social issues, elections, and politics stay visible for 7 years. Ads that deliver in the European Union stay in the archive for 1 year after their last impressionImpressionThe number of times your ad or page appeared on a screen. An impression is not a person and not a search.Open the glossary.
That page does not promise an archive for ordinary ads outside the European Union. So the list of competitor ads that you see leans toward ads that are still alive. Ads that a competitor stopped because they lost money usually do not appear as evidence in front of you.
Before you start: prepare 5 things
- 1 success claim that you want to copy, written in 1 sentence.
- A list of similar businesses in your city or market, including the ones that closed.
- Order data for the last 3 months: new customers, customers who ordered again, and refunds.
- A list of customers who gave you permission to contact them.
- A test budget limit and 1 empty spreadsheet.
If you have no repeat order data yet, start to record the customer number and the order date this week. Chat history and marketplace history can be a temporary source.
Step 1: Write the claim that you want to copy and find its denominator
Write the claim in 1 sentence, for example "Brand X opened 3 branches in 12 months and succeeded". Below it, write the denominator question: how many businesses tried the same method, and how many are still open?
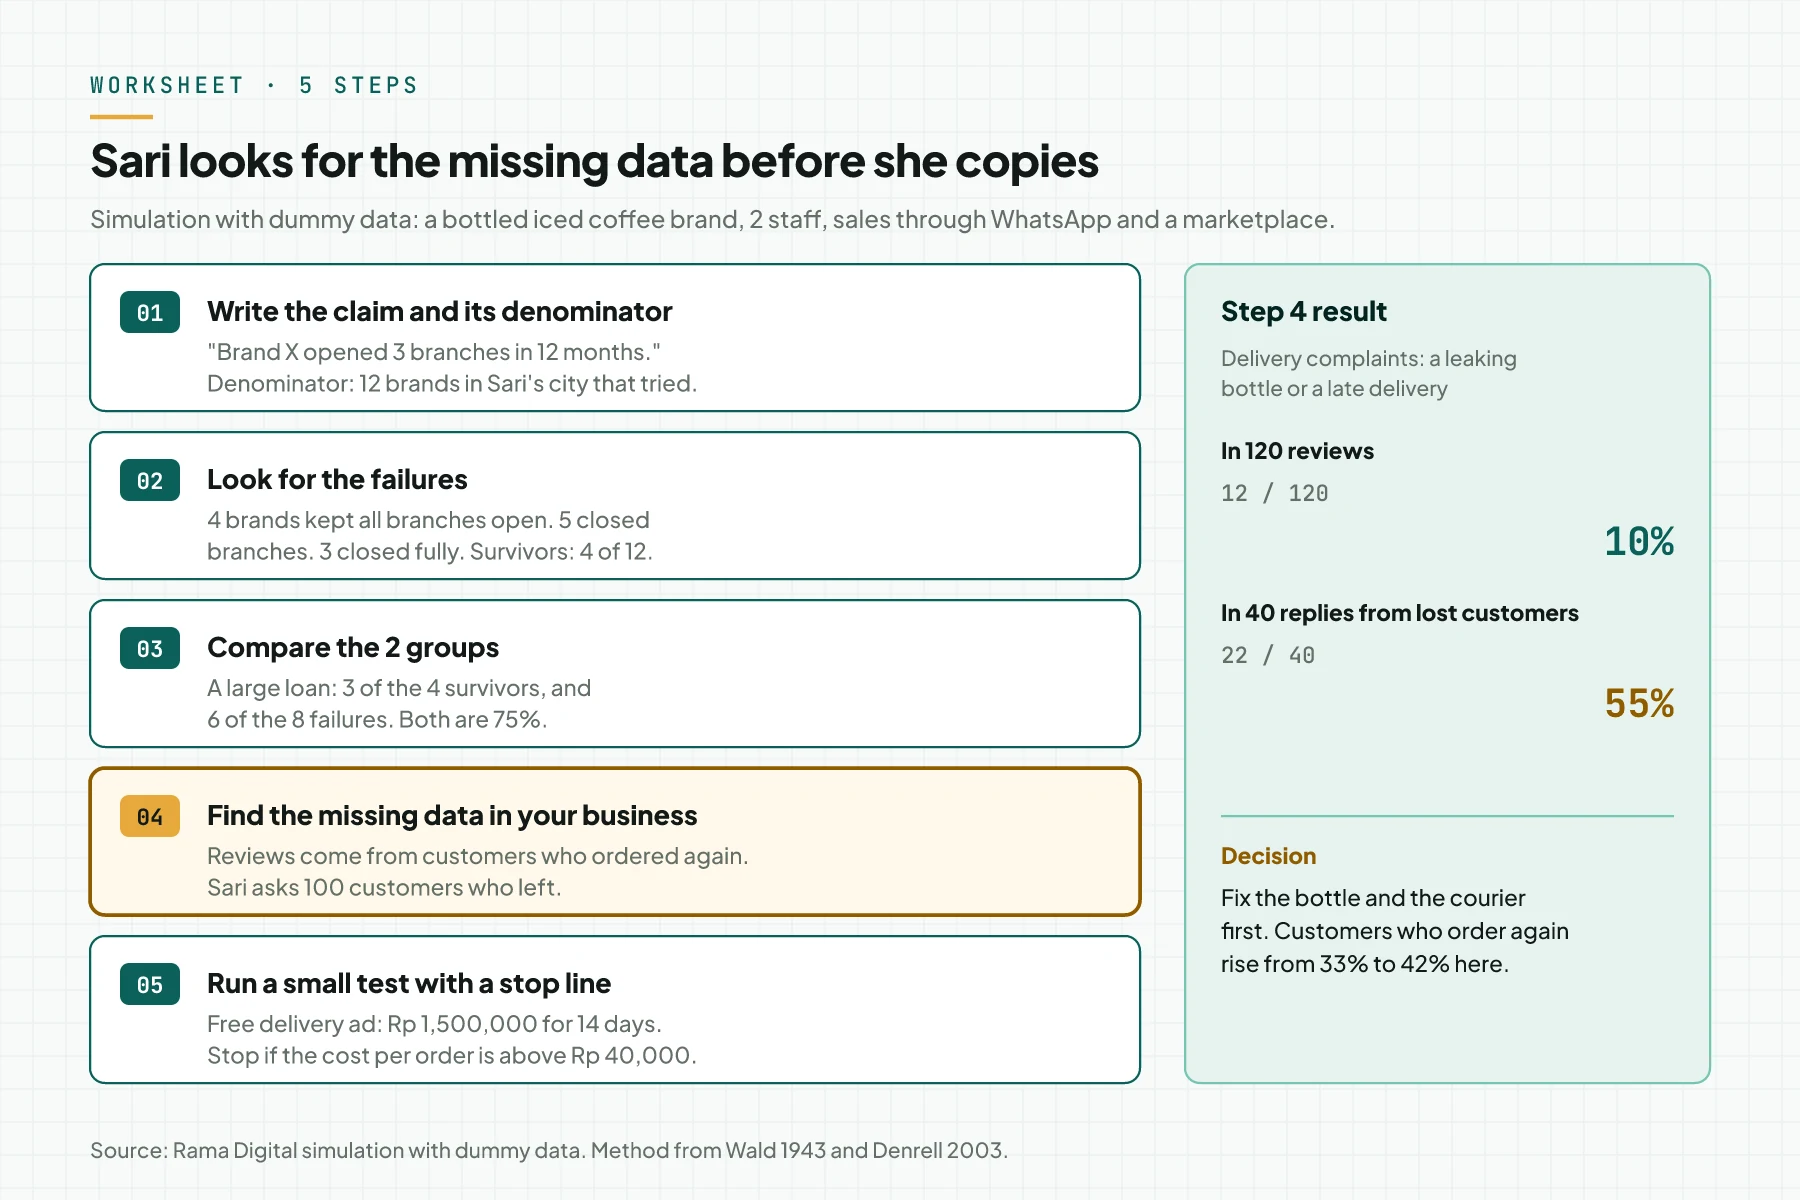
The denominator is the number that is missing from a success story. With no denominator, 1 success story can come from 2 tries or from 200 tries. As a scale, the BLS data gives about 51 of 100 new business sites still open after 5 years. Check: the claim and the denominator question are written, and you know where to find a list of the businesses that tried.
Step 2: Look for the failures and the ones that stopped
Make a list of the businesses that tried the same method in 1 period, for example the year 2023. Find the ones that are still open and the ones that closed. Write a source for each row.
Sources that you can use: the Permanently closed label on Google Maps, business community groups, marketplace shops that are not active, and Instagram accounts that stopped posting. Also ask suppliers and former employees, because they see the businesses that close. Check: the table has the successes and the failures, with 1 source per row.
Step 3: Compare the practices in the success and failure groups
Choose 2 to 3 practices from the success story, for example a large loan, the location, or the time spent selling online. Calculate what percent of the successful businesses used the practice, then what percent of the failed businesses used it.
If the practice appears equally often in both groups, the practice is not the difference. This is the finding of Denrell (2003): a risky practice can look good only because the failures are gone. When you judge your own success, write it as the case of another founder. The article on Solomon's paradox explains how. Check: each practice has 2 percentages, 1 for the successes and 1 for the failures.
Step 4: Find the missing data in your own business
Use Wald's method on your own data. Compare the voice of the group that stayed with the voice of the group that left. Examples of the group that left: customers who did not order again, leads who did not reply, and buyers who asked for a refund.
Send 1 short question to the customers who left, for example "What is 1 reason that you have not ordered again?". Send it only to people who gave you permission to contact them. Then compare the replies with the reviews. A topic that is rare in the reviews but frequent in the replies is the "engine hit" of your business. Check: you have at least 30 replies and 1 table that compares the topics.
Step 5: Run a small test with a stop line before you copy in full
Before you copy in full, run a small test. Write 3 things before the test starts: the budget, the end date, and the stop line. Example: Rp 1,500,000 for 14 days, and stop if the cost per order is above Rp 40,000.
The stop line protects you from the sunk cost fallacy: money that is already spent is not a reason to continue. The end date keeps the test from expanding. The article on Parkinson's law explains how to calculate a deadline from data. Check: the budget, the end date, and the stop line are written before the first money goes out.
Simulation: Sari and a bottled iced coffee brand
This example uses dummy data. Sari sells bottled iced coffee with 2 staff, through WhatsApp and a marketplace. She wants to copy 3 things: fast branches from a founder podcast, a free delivery ad from a competitor, and the testimonials of a competitor.
For the fast branch claim, Sari lists 12 brands in her city that opened a 3rd branch within 12 months in 2023. In October, 4 brands kept all branches open. 5 brands closed 1 branch or more, and 3 brands closed fully.
| Group (simulation) | Number of brands | Used a large loan | Sold online for 2 years or more before the 2nd branch |
|---|---|---|---|
| Kept all branches open | 4 | 3 of 4, 75% | 4 of 4, 100% |
| Closed 1 branch or more | 5 | 4 of 5, 80% | 2 of 5, 40% |
| Closed fully | 3 | 2 of 3, 67% | 0 of 3, 0% |
| All failures | 8 | 6 of 8, 75% | 2 of 8, 25% |
A large loan appears in 75% of the brands that survived and in 75% of the brands that failed. So the loan is not the difference. Selling online for 2 years or more appears in 100% of the survivors and in 25% of the failures. 12 brands are too few for evidence, so Sari uses this result as a hypothesis.
For the testimonials, Sari opens the data of her own shop. From July to September, she got 900 new customers. 300 customers ordered again within 30 days, or 33%. 600 customers did not order again.
| Source of customer voice (simulation) | Number | Mention delivery | Mention price | Praise the taste |
|---|---|---|---|---|
| Reviews received, July to September | 120 | 12, 10% | not counted | 84, 70% |
| Replies from customers who did not order again | 40 of the 100 asked | 22, 55% | 10, 25% | not counted |
Almost all reviews come from customers who ordered again. In the reviews, delivery complaints are only 10%. In the replies from customers who left, delivery complaints are 55%. This is the same as the engine hits in Wald's example: the problem is rarely visible because those customers already left.
| Date (simulation) | Event | What is recorded | Decision |
|---|---|---|---|
| 1 Oct | Sari writes 3 claims that she wants to copy. | Fast branches, a free delivery ad, and testimonials. | Find the denominator for each claim. |
| 3 Oct | Sari lists the brands that opened a 3rd branch within 12 months in 2023. | 12 brands. 4 kept all branches open. | Compare the survivors and the failures. |
| 6 Oct | Sari fills in the practice table. | A large loan: 75% in both groups. | Put the loan plan on hold. |
| 8 Oct | Sari sends 1 question to 100 customers who did not order again. | All recipients gave Sari permission to contact them. | Wait 48 hours for replies. |
| 10 Oct | Sari reads 40 replies. | 22 mention a leaking bottle or a late delivery. | Change to a sealed bottle and a new courier. |
| 13 Oct | The free delivery ad test starts. | Rp 1,500,000 for 14 days. Limit Rp 40,000 per order. | Run it with no extra budget. |
| 27 Oct | The ad test ends. | 28 orders, Rp 53,571 per order. | Stop the ad, as the limit says. |
| 30 Nov | Sari checks the new customers from 11 to 31 October. | 126 of 300 ordered again within 30 days, or 42%. | Keep the new bottle and courier. |
The free delivery ad test gave 28 orders from Rp 1,500,000, or Rp 53,571 per order. That number is above the Rp 40,000 limit, so Sari stopped the ad on day 14. The competitor ad may make money because the competitor has different costs, or it may lose money. Sari does not need to know the answer to make her decision.
The bottle and courier fix raised the share of customers who ordered again from 33% to 42%. These numbers are an example, and your business result can differ.
Checklist for the first 30 days
- Write 1 success claim that you want to copy and its denominator question. Owner: you. Evidence: 1 claim sentence and 1 question sentence.
- List the businesses that tried the same method, including the ones that closed. Owner: you or 1 staff member. Evidence: a table with a source per row.
- Calculate the percent of each practice in the success and failure groups. Owner: you. Evidence: a 2-group table.
- Send 1 question to customers who did not order again and gave permission. Owner: chat admin. Evidence: at least 30 replies.
- Compare the topics in reviews with the topics in the replies from customers who left. Owner: you. Evidence: a table of topics and percentages.
- Write the budget, the end date, and the stop line for a small test. Owner: budget owner. Evidence: a dated note before the test starts.
- Measure the customers who order again before and after the fix. Owner: you. Evidence: 2 percentages for periods of the same length.
- Stop the test when the cost per order passes the limit, or when the end date comes with no result below the limit. Owner: budget owner. Evidence: a dated decision note.
When a success story is still useful
A success story is useful as a source of ideas and as an example of how to do the work. A success story is also useful when its denominator is known, for example data on all the participants of a program, not only the alumni who succeeded.
A success story is weak as evidence of a cause. Be careful with 3 signs: no denominator, no failure examples, and a high-risk practice. When those 3 signs appear, turn the claim into a hypothesis and run a small test.
This bias is also not a reason to refuse all advice. Founders who failed can also misjudge the cause of their failure. The goal is to see both groups, not to choose the other group instead.
Frequently asked questions
What is survivorship bias? Survivorship bias is the error of drawing a conclusion only from what survived, because the failures are already gone from the data. An example is copying a successful founder without looking at the founders who used the same method and closed.
What is an example of survivorship bias in business? Examples are copying a success story from a podcast, reading the testimonials of a competitor, copying competitor ads that still run, and reading only the reviews of customers who ordered again. In each example, the group that failed or left is out of view.
Is the Abraham Wald plane story true? The Wald memos are real. The Statistical Research Group issued the 8 memos in 1943, and CNA reprinted them in 1980. The numbers in the memos are hypothetical, and the picture of a plane with red dots is a modern illustration made from 2005 to 2021.
What is the difference between survivorship bias and selection bias? Selection bias appears when a sample does not represent the whole population. Survivorship bias is 1 type of selection bias: the process that filters the sample is survival.
How do I find failure data when competitors do not share it? Use public sources such as the Permanently closed label on Google Maps, community groups, and marketplace shops that are not active. For decisions in your own business, the strongest data is the data of your own customers who left.
How many new businesses survive? In the US, 50.7% of the business sites that opened in the year to March 2016 were still open after 5 years, and 34.2% after 10 years, according to BLS Table 7. The numbers for Indonesia can differ.
Next step
The limit still applies: Wald's example is hypothetical, and the BLS data comes from the US. The data that small businesses lose most often is the data of buyers who left and leads who did not reply. Data Health Audit checks GA4GA4The Google analytics tool that records visits and actions on your site as events.What is Google Analytics 4 (GA4)?, PixelPixelA piece of code on a web page that tells the ad platform somebody opened the page or took an action.What is the Meta Pixel?, CAPICAPIA server path that sends conversion data from your system to the ad platform, without depending on the buyer browser.What is the Conversions API (CAPI)?, UTMUTMA label you attach to a page address to mark the source of a visit, for example the campaign and the channel.Open the glossary, and events in 1 week, then gives you a list of data gaps and fix priorities. Book a 30-minute session if you want to discuss 1 success claim that you want to copy with us.
Sources
- Abraham Wald, "A Method of Estimating Plane Vulnerability Based on Damage of Survivors", Statistical Research Group, Columbia University, 1943, SRG memos 85, 87, 88, 89, 96, 103, 109, and 126. We read the full text of the CNA reprint of the Wald memos (CRC 432, July 1980), 100 pages. See also the CNA catalog page.
- Mangel and Samaniego (1984). "Abraham Wald's Work on Aircraft Survivability", Journal of the American Statistical Association 79(386), pp. 259 to 267. We read the abstract.
- Brown, Goetzmann, Ibbotson, and Ross (1992). "Survivorship Bias in Performance Studies", The Review of Financial Studies 5(4), pp. 553 to 580. We read the abstract on RePEc.
- Carhart, Carpenter, Lynch, and Musto (2002). "Mutual Fund Survivorship", The Review of Financial Studies 15(5), pp. 1439 to 1463. We read the abstract.
- Denrell (2003). "Vicarious Learning, Undersampling of Failure, and the Myths of Management", Organization Science 14(3), pp. 227 to 243. We read the abstract.
- U.S. Bureau of Labor Statistics, Business Employment Dynamics, Table 7 of the BLS Business Employment Dynamics data, all private sectors, data to March 2026. We read the full table, the sector tables for accommodation and food services and professional, scientific, and technical services, and the BLS FAQ.
- Wikimedia Commons, file "Survivorship-bias.svg", its file page on Wikimedia Commons. We read the description and the file history.
- Meta, the Meta Ad Library tools page. We read the rules on which ads appear.
We opened all sources on 29 October 2026.