Direct answer: The sunk cost fallacy is the error of continuing a project, an ad, or a contract because money, time, or effort is already spent. That money is the sunk cost. A sunk cost does not come back, whatever you choose today. So a correct decision compares only future cost with future result, then picks the path with the largest difference.
Main condition: This method applies when you must choose to continue, change, or stop, and you have result data for the last 14 to 30 days. Limit: This article is not investment advice or legal advice. The method does not remove risk. It only keeps past money out of a new decision.
We read 7 research sources on 25 October 2026: Arkes and Blumer (1985), Staw (1976), Arkes and Hutzel (2000), Friedman et al. (2007), Sweis et al. (2018), Arkes and Ayton (1999), and the replication notes on FORRT. We did not run our own experiment. The ad numbers in the simulation are dummy data, not client data.
The problem: "we already spent so much"
This sentence comes up in small meetings and in the head of a business owner. "The ads already ran for 2 weeks." "The app is already 70% done." "This agency contract must pay for itself first."
Each of these sentences uses the past as the reason. None of them names a future result.
The cost is real. You add budget to ads that do not sell. You pay a developer to patch an app that is cheaper to rebuild. The article about an AI-built app that breaks with every new feature shows this pattern in software projects.
Ads give the fastest example. Many advertisers wait "until the money comes back", but 14 days of data already give an answer.
The main problem is not a lack of data. The problem is that past money enters the sum without your notice.
How it works: why past money pulls us to continue
A sunk cost looks simple on paper. In practice, research finds 3 forces that make people continue. Research also finds that the strength of these forces differs between studies.
1. Past money feels like a reason to continue
Arkes and Blumer (1985) define the sunk cost effect as a greater tendency to continue an endeavor once an investment of money, effort, or time has been made. Later research starts from this definition.
Their field study used season tickets for a campus theater. 60 buyers were put at random into 3 groups: full price, a 2-dollar discount, and a 7-dollar discount. The full-price group went to more plays in the first half of the season. In the second half, the 3 groups did not differ. Friedman et al. (2007) summarize these details and say that the evidence is not as strong as one might hope.
Arkes and Hutzel (2000) repeat the explanation of Arkes and Blumer: people do not want to appear wasteful. So a sunk cost works through a dislike of waste, not through a profit calculation.
2. Personal responsibility raises the stakes
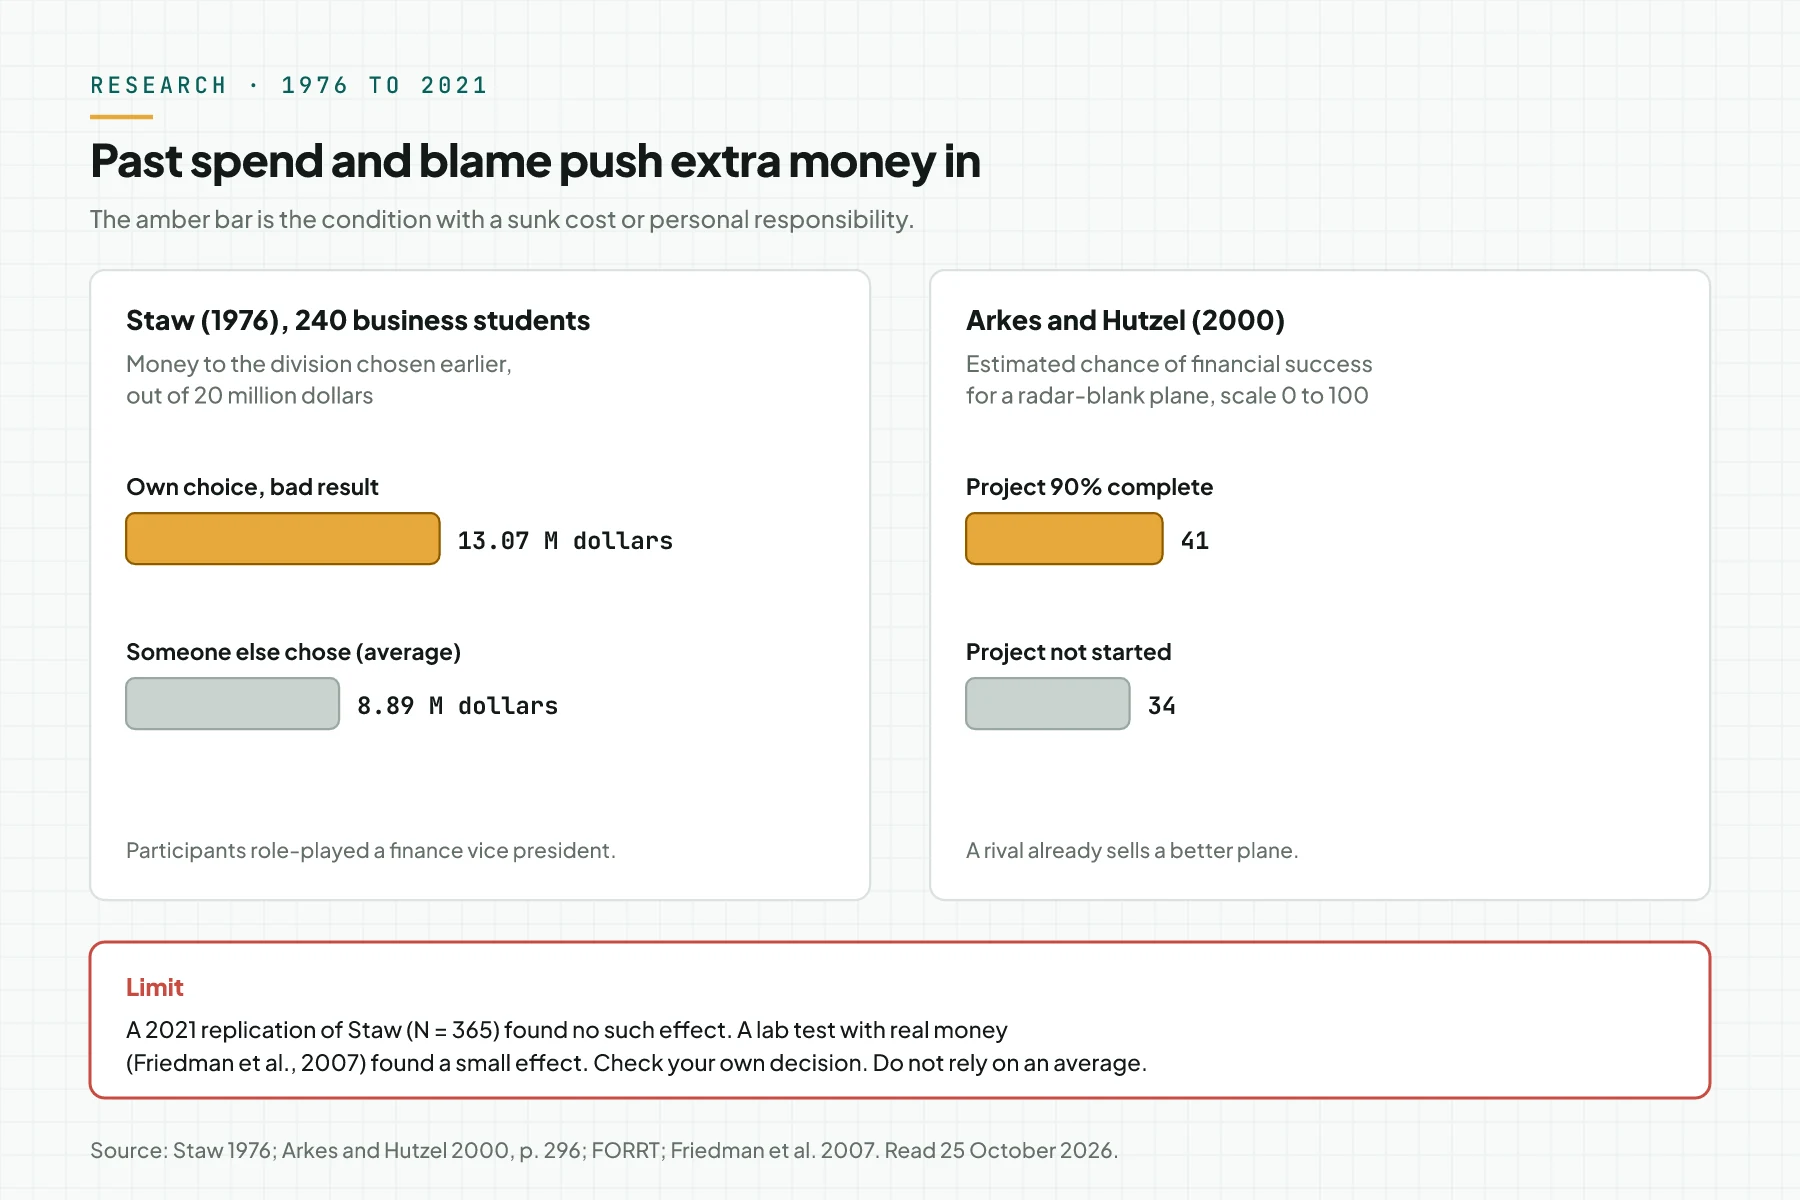
Staw (1976) asked 240 business school students to act as a finance vice president. In part 1, they chose 1 division for 10 million dollars of research money. In part 2, they divided 20 million dollars after they saw 5 years of results.
Participants who chose themselves and saw a bad result gave an average of 13.07 million dollars to the same division. Participants who received the choice from another officer gave an average of 8.89 million dollars. Staw called this pattern escalation of commitment.
The person who chose the first path finds it hardest to stop, so the reviewer of a decision should be someone who did not make the first choice. Step 5 below uses this finding.
3. A sunk cost makes success look more likely
Arkes and Hutzel (2000) quote the radar-blank plane scenario from Arkes and Blumer. A company has already invested 10 million dollars, and then a rival sells a faster and cheaper plane. Respondents who read about a project that was 90% complete gave a financial success chance of 41 out of 100. Respondents who read about a project that had not started gave 34.
Their second experiment asked for the estimate before or after the investment decision. The estimate after the decision was higher. So optimism often comes after we decide to continue, not before.
The same paper quotes Cooper et al. (1988). Of 3,000 new business owners, 1 in 3 was 100% certain that the business would succeed. A founder must write down the chance of success before adding money, not after.
4. How strong is this effect?
The sunk cost effect is not equally strong in every study. Friedman et al. (2007) tested people in a laboratory with real money. They found a small effect, and the psychological drivers that they tested did not change the result much.
The FORRT replication atlas lists 2 replications of the Staw study. Białek et al. (2021), with 365 participants, found no escalation of commitment. Participants simply added money to the more promising projects. Schultze and Schulz-Hardt (2022) got a mixed result.
On the other side, Sweis et al. (2018) found the same pattern in mice, rats, and humans: the longer a subject had already waited, the less willing it was to quit. Before that, Arkes and Ayton (1999) concluded that there was no clear instance in animals.
Rama Digital recommendation: do not rely on willpower to "be more rational". Put a written procedure in place. The procedure works whether this effect is small or large in you.
5. When the past still counts
Not everything that comes from the past must go. These 4 items are future value or future cost, so they stay in the sum:
- Salvage value: stock, equipment, or design that you can still sell or use again.
- Data you already have: 61 past chats are an asset for retargetingRetargetingShowing ads to people who already interacted with you, for example opened a page or sent a chat.Open the glossary, not a cost.
- Exit cost: a contract penalty, a data move, or severance pay.
- Promises to customers: a refund or a service that you must still deliver.
Only the part that is fully used and cannot come back leaves the sum.
Terms compared: what counts in the decision
People often mix up these 5 terms. The table uses the numbers from the simulation below.
| Term | Meaning | Counts in the decision? | Business example |
|---|---|---|---|
| Sunk cost | Money, time, or effort that is already spent and cannot come back. | No | Rp 4,200,000 for 14 days of ads that already ran. |
| Future cost | Money and time that go out from today if you choose 1 path. | Yes | Rp 4,200,000 for the next 14 days of ads. |
| Salvage value | The part of an old asset that you can still sell or use again. | Yes, as a result | Stock, ad design, and 61 past chats for retargeting. |
| Opportunity cost | The result of the other option that you give up. | Yes | Rp 1,500,000 that could pay for retargeting. |
| Exit cost | A cost that occurs because you stop. | Yes | A 1-month penalty to end an agency contract. |
The first row is the only one that leaves the sum. The other 4 rows stay, because they all occur from today on.
Before you start: prepare 5 things
- A cost record per item: ads, salaries, contracts, tools, and work hours.
- Result data for 14 to 30 days from a source you can open again: sales, chats, or leads.
- At least 1 other option for the same money.
- 1 reviewer who did not choose the first path.
- 30 quiet minutes and 1 empty worksheet.
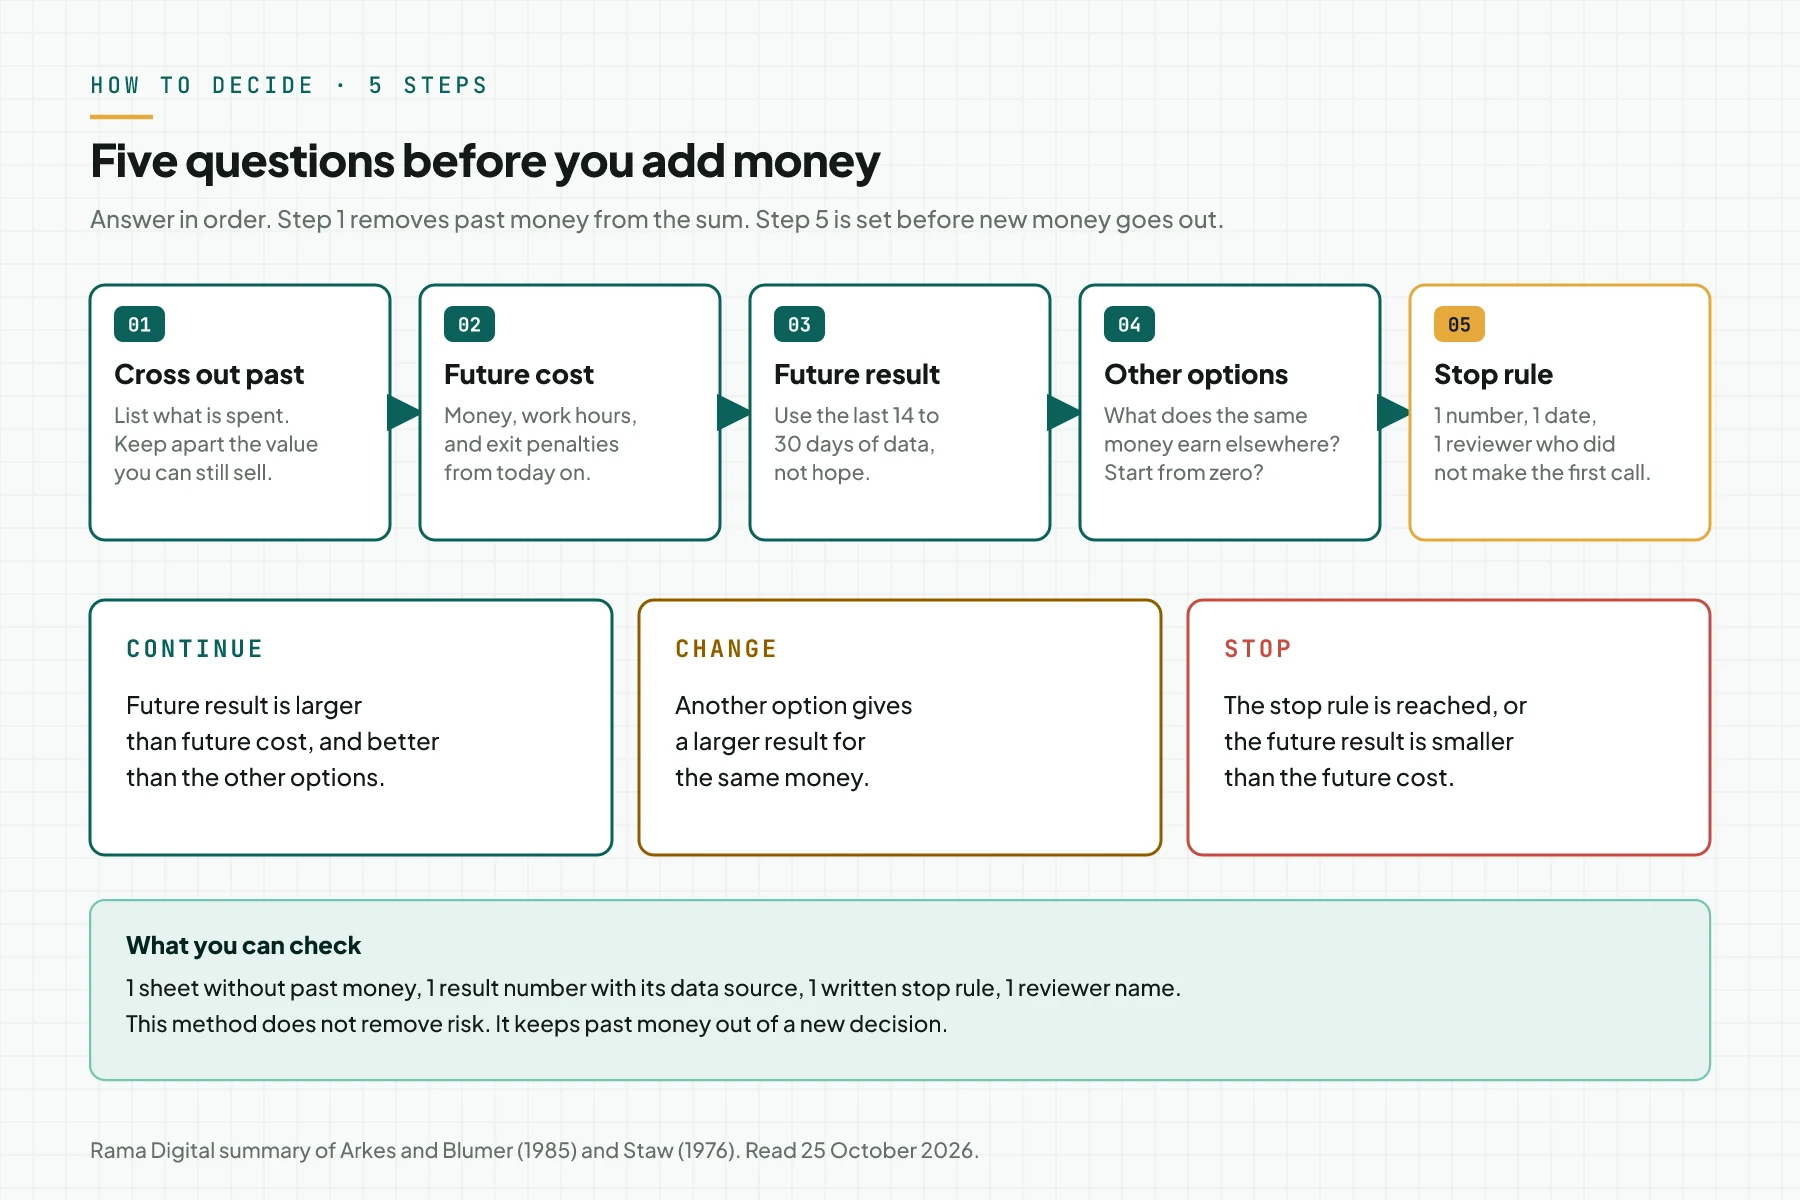
The flow below sums up the 5 steps. Each step has 1 check that you can prove.
Step 1: Cross money already spent out of the sum
Write down each item that you already paid: ads, salaries, contracts, tools, and your work hours. Mark each item that cannot come back as "sunk". Keep the salvage value apart, for example stock you can still sell or a design you can use again.
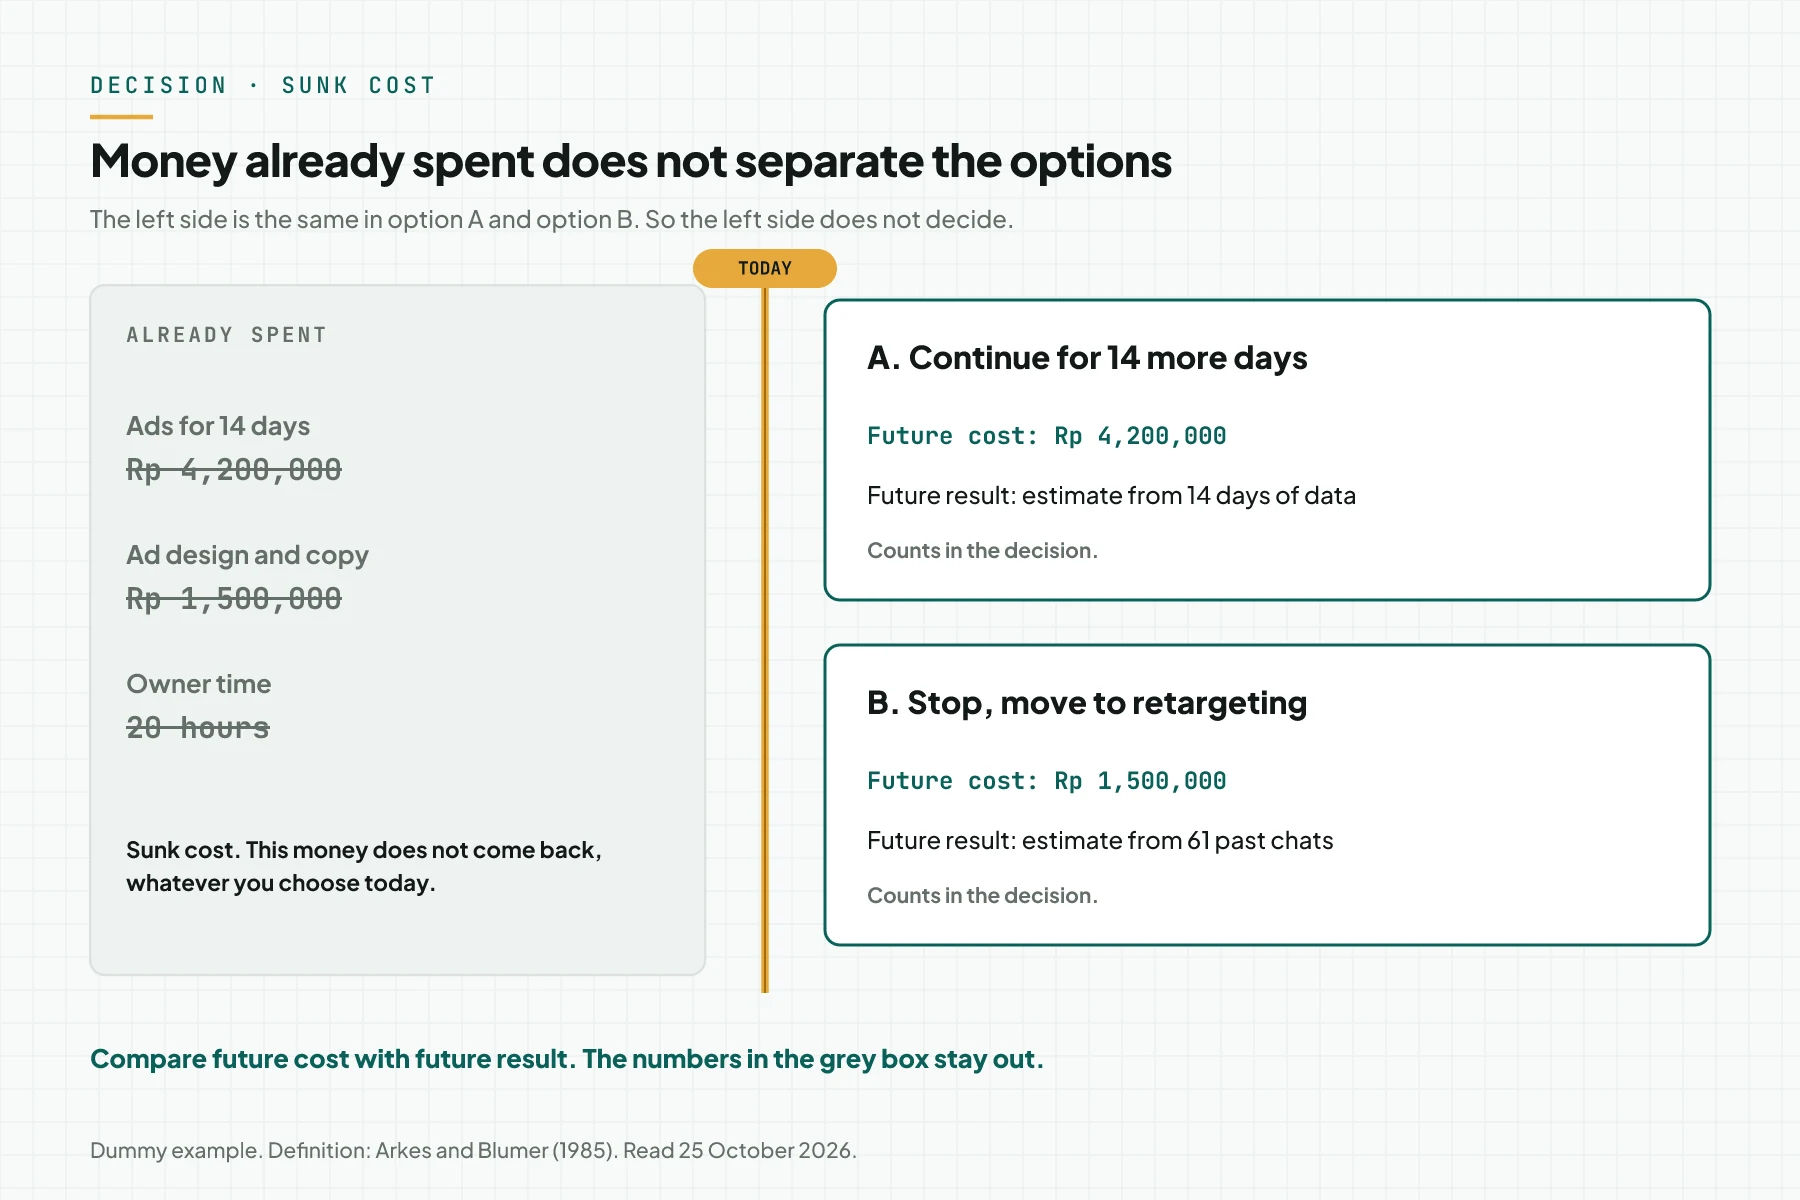
Fill the worksheet with 2 columns: "already spent" and "salvage value". Check: the numbers in the "already spent" column do not appear again in steps 2 to 5.
Step 2: Calculate the future cost of each option
For each option, write the money and time that go out from today. Include exit costs, for example a contract penalty or a data move. Use the same period for all options, for example the next 14 days.
The "stop" option also has a cost, although it is sometimes Rp 0. Check: each option has 1 future cost number for the same period.
Step 3: Write the future result from data, not from hope
Estimate the result of each option from the last 14 to 30 days of data. For ads, use sales per rupiah, not the number of clicks. If the product has a unit cost, use margin, not revenue.
The guide on how to calculate ROAS and break-even ROAS shows how to calculate the break-even point from margin. Write this estimate before you decide, because Arkes and Hutzel found that success estimates rise after people decide to continue. Check: each result number has a data source that you can open again.
Step 4: Compare with other options for the same money
Ask 1 question: if I started from zero today with the same money, would I choose this path? Then write at least 2 other options: change the method, move the money, or stop. The difference between future result and future cost is the basis of the decision.
The result of the option you give up is the opportunity cost. The article about the difference between a revenue model and a business model helps when another option changes how the business earns money. Check: your table has at least 3 rows: continue, change, and stop.
Step 5: Set a stop rule before new money goes out
Write 1 number, 1 date, and 1 reviewer name before you add money. Example: "If sales are below Y by date X, I stop and move the remaining money." Choose a reviewer who did not choose the first path, because the Staw study shows that the first chooser finds it hardest to stop.
A founder without a partner can use a mentor, an accountant, or a fellow founder as the reviewer. Check: the stop rule is written and sent to the reviewer before the money goes out.
Simulation: online class ads that "must earn the money back"
This example uses dummy data. A small business sells an online Excel class for Rp 499,000. The unit cost per participant is almost zero, so we use revenue as the result.
| Date (simulation) | Event | What is recorded | Decision |
|---|---|---|---|
| 1 Sep | WhatsApp message ads start at Rp 300,000 per day. Design and copy, Rp 1,500,000, are already paid. | Ad cost Rp 0, 0 chats. | No written stop rule. |
| 7 Sep | Day 7. | Ad cost Rp 2,100,000, 34 chats, 1 sale. | "It has only been a week." The ads continue. |
| 14 Sep | Day 14. | Ad cost Rp 4,200,000, 61 chats, 3 sales, revenue Rp 1,497,000. | The owner wants 14 more days to "earn back Rp 5,700,000". |
| 15 Sep | Recalculate with the 5 steps. | Rp 5,700,000 is crossed out of all options. | Choose B. Stop rule: if retargeting sells fewer than 2 by 22 Sep, stop. |
| 22 Sep | Check the stop rule. | Retargeting: cost Rp 750,000, 3 sales. | The rule is not reached. Continue to 29 Sep. |
| 29 Sep | End of period. | Retargeting: cost Rp 1,500,000, 5 sales, revenue Rp 2,495,000. | Future difference +Rp 995,000. |
The second table holds only future numbers on 15 September. The Rp 5,700,000 is not in this table, because that number is the same in all 3 options.
| Option on 15 Sep | Future cost (14 days) | Future result (estimate) | Difference |
|---|---|---|---|
| A. Continue the same ads | Rp 4,200,000 | 3 sales, Rp 1,497,000. Rate of the last 14 days. | -Rp 2,703,000 |
| B. Stop new ads, retarget 61 past chats | Rp 1,500,000 | 5 sales, Rp 2,495,000. Assumes 8% of 61 chats. | +Rp 995,000 |
| C. Stop completely | Rp 0 | Rp 0 | Rp 0 |
Option A feels right because "the 5.7 million must come back". The future calculation shows that A adds a loss of Rp 2,703,000. Option B wins because it uses salvage value: the 61 chats that already exist.
The 8% figure is a simulation assumption. The stop rule on 22 September tests that assumption in 7 days, so an estimate error stops at Rp 750,000.
Checklist before you add money
- Write the list of sunk costs and salvage value. Owner: business owner. Evidence: a worksheet with 2 columns.
- Pull 14 to 30 days of result data from the original source. Owner: ad admin or finance. Evidence: a dated report export.
- Calculate the future cost of at least 3 options for the same period. Owner: business owner. Evidence: a 3-row table.
- Write the result estimate before you decide. Owner: business owner. Evidence: a dated number on the worksheet.
- Ask 1 reviewer who did not make the first choice to read the table. Owner: reviewer. Evidence: a written reply from the reviewer.
- Set a stop rule with 1 number and 1 date. Owner: business owner. Evidence: a message to the reviewer before the money goes out.
- Stop on the day the rule is reached, then move the remaining money. Do not open a new discussion without new data. Owner: business owner. Evidence: a note of the stop date.
When to decide alone, and when to ask for help
Decide alone when the decision is small, the data is clear, and you have a reviewer. The 5 steps above are enough for that case.
Ask for help when result data sits in many tools, when you cannot pull sales per source, or when the decision touches a team and contracts. An outside reviewer does not carry the responsibility for the first choice.
Frequently asked questions
What does the sunk cost fallacy mean? It means you continue something because money, time, or effort is already spent, not because the future result is larger than the future cost. In Indonesian it is called kekeliruan biaya hangus.
What is the difference between the sunk cost fallacy and escalation of commitment? The sunk cost fallacy is the error of counting past money in a new decision. Escalation of commitment is the repeated pattern of adding money to a failing path. Staw (1976) found that pattern strongest when people chose the first path themselves.
Is it always wrong to consider money already spent? No. Salvage value, data you already have, exit costs, and promises to customers stay in the sum. Only money that is fully used and cannot come back leaves the sum.
How long should I wait before I stop an ad? No single number fits every business. Write a stop rule before the ad runs: a maximum cost, a minimum result, and a check date. Use 14 to 30 days of data if your sales volume is small.
How does a founder without a partner avoid the sunk cost fallacy? Borrow another pair of eyes. Send the decision table and the stop rule to a mentor, an accountant, or a fellow founder before the money goes out. The Staw study shows that the person who chose the first path finds it hardest to stop.
Do animals also show the sunk cost effect? Recent research finds a similar pattern. Sweis et al. (2018) saw mice, rats, and humans become less willing to quit as the time they had already waited grew. Arkes and Ayton (1999) earlier found no clear instance in animals.
Next step
The limit still applies: this method does not remove risk, and a result estimate can still be wrong. AI Diagnostic maps the bottlenecks of your business in 1 session of 60 to 90 minutes, then gives you written first steps. Book a 30-minute session if you want to review 1 continue-or-stop decision with us.
Sources
- Arkes and Blumer (1985). "The psychology of sunk cost", Organizational Behavior and Human Decision Processes 35. The sunk cost effect definition and the theater ticket study.
- Staw (1976). "Knee-deep in the big muddy", Organizational Behavior and Human Performance 16, pp. 27 to 44. 240 participants, 13.07 and 8.89 million dollars.
- Arkes and Hutzel (2000). Journal of Behavioral Decision Making 13, pp. 295 to 306. The radar-blank plane, 41 against 34, the waste explanation, and the Cooper et al. (1988) quote.
- Friedman et al. (2007). "Searching for the sunk cost fallacy", Experimental Economics 10. A lab test with real money and a summary of the theater study.
- Sweis et al. (2018). Science 361, pp. 178 to 181. Mice, rats, and humans.
- Arkes and Ayton (1999). Psychological Bulletin 125, pp. 591 to 600. The sunk cost and Concorde effects.
- The FORRT replication atlas. Replications of Staw (1976): Białek et al. (2021) and Schultze and Schulz-Hardt (2022).
All sources were read on 25 October 2026.