Direct answer: Startup funding stages run from pre-seed, seed, Series A, Series B, and Series C to an exit through acquisition or IPO. Pre-seed and seed use SAFEs or convertible notes; Series A and later use preferred stock with a share price. Each stage sells a median 8-18% of the company (US/global data, Carta, 10 July 2026). No stage is required; some companies start directly at Series A (YC).
Main condition: this map applies to startups on the venture capital path. Median sizes and valuations are US/global (Carta) and Southeast Asia (Cento) data opened on 14 September 2026; the region is written next to every number. Limit: Rama Digital is not a financial, legal, or tax adviser. This article explains the mechanism and the calculation, not a funding promise or a result. A licensed legal and financial adviser must review every funding decision, valuation, and agreement. A median is not a target; every deal differs. The detailed valuation and dilution formulas live in how to calculate Series A valuation and dilution, not here.
We read YC, Carta, Cento, and NVCA on 14 September 2026 for this article. The founder-ownership example in the simulation section uses labelled dummy data, not client data.
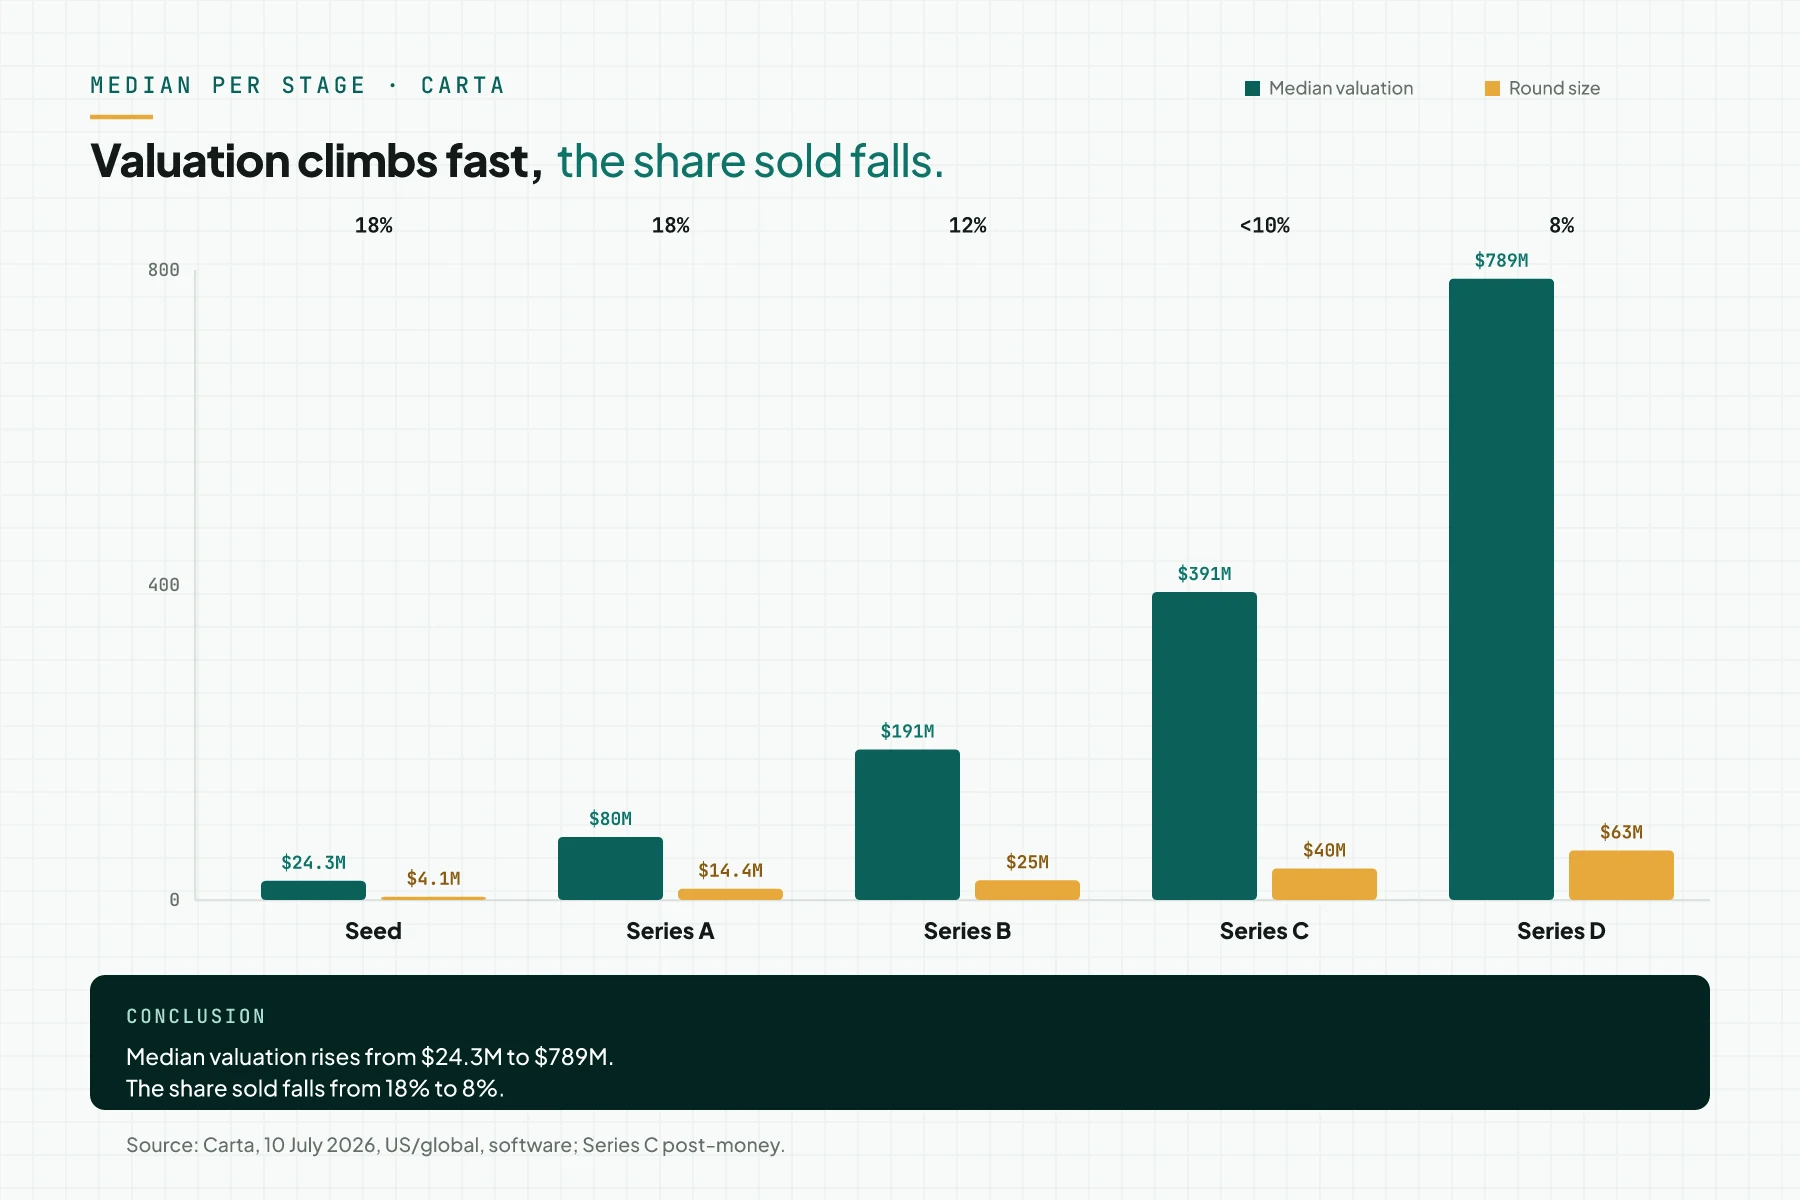
- US/global medians: seed $24.3M on $4.1M raised, 18% dilution. Series A $80M on $14.4M, 18%; Series B $191M on $25M, 12% (Carta, 10 July 2026).
- Series C median post-money $391M on nearly $40M, under 10%. Series D $789M on $63M, 8% (Carta, 10 July 2026).
- Southeast Asia 2024: Pre-A valuation about $5M. Series A pre-money $20.0M, size $4.0M; Series B pre-money $52.0M, size $8.0M (Cento, 2024).
- US pre-seed Q1 2026: about 3,000 startups raised over $2.3B. SAFEs are the default instrument; convertible notes were only 7% of rounds (Carta, 14 May 2026).
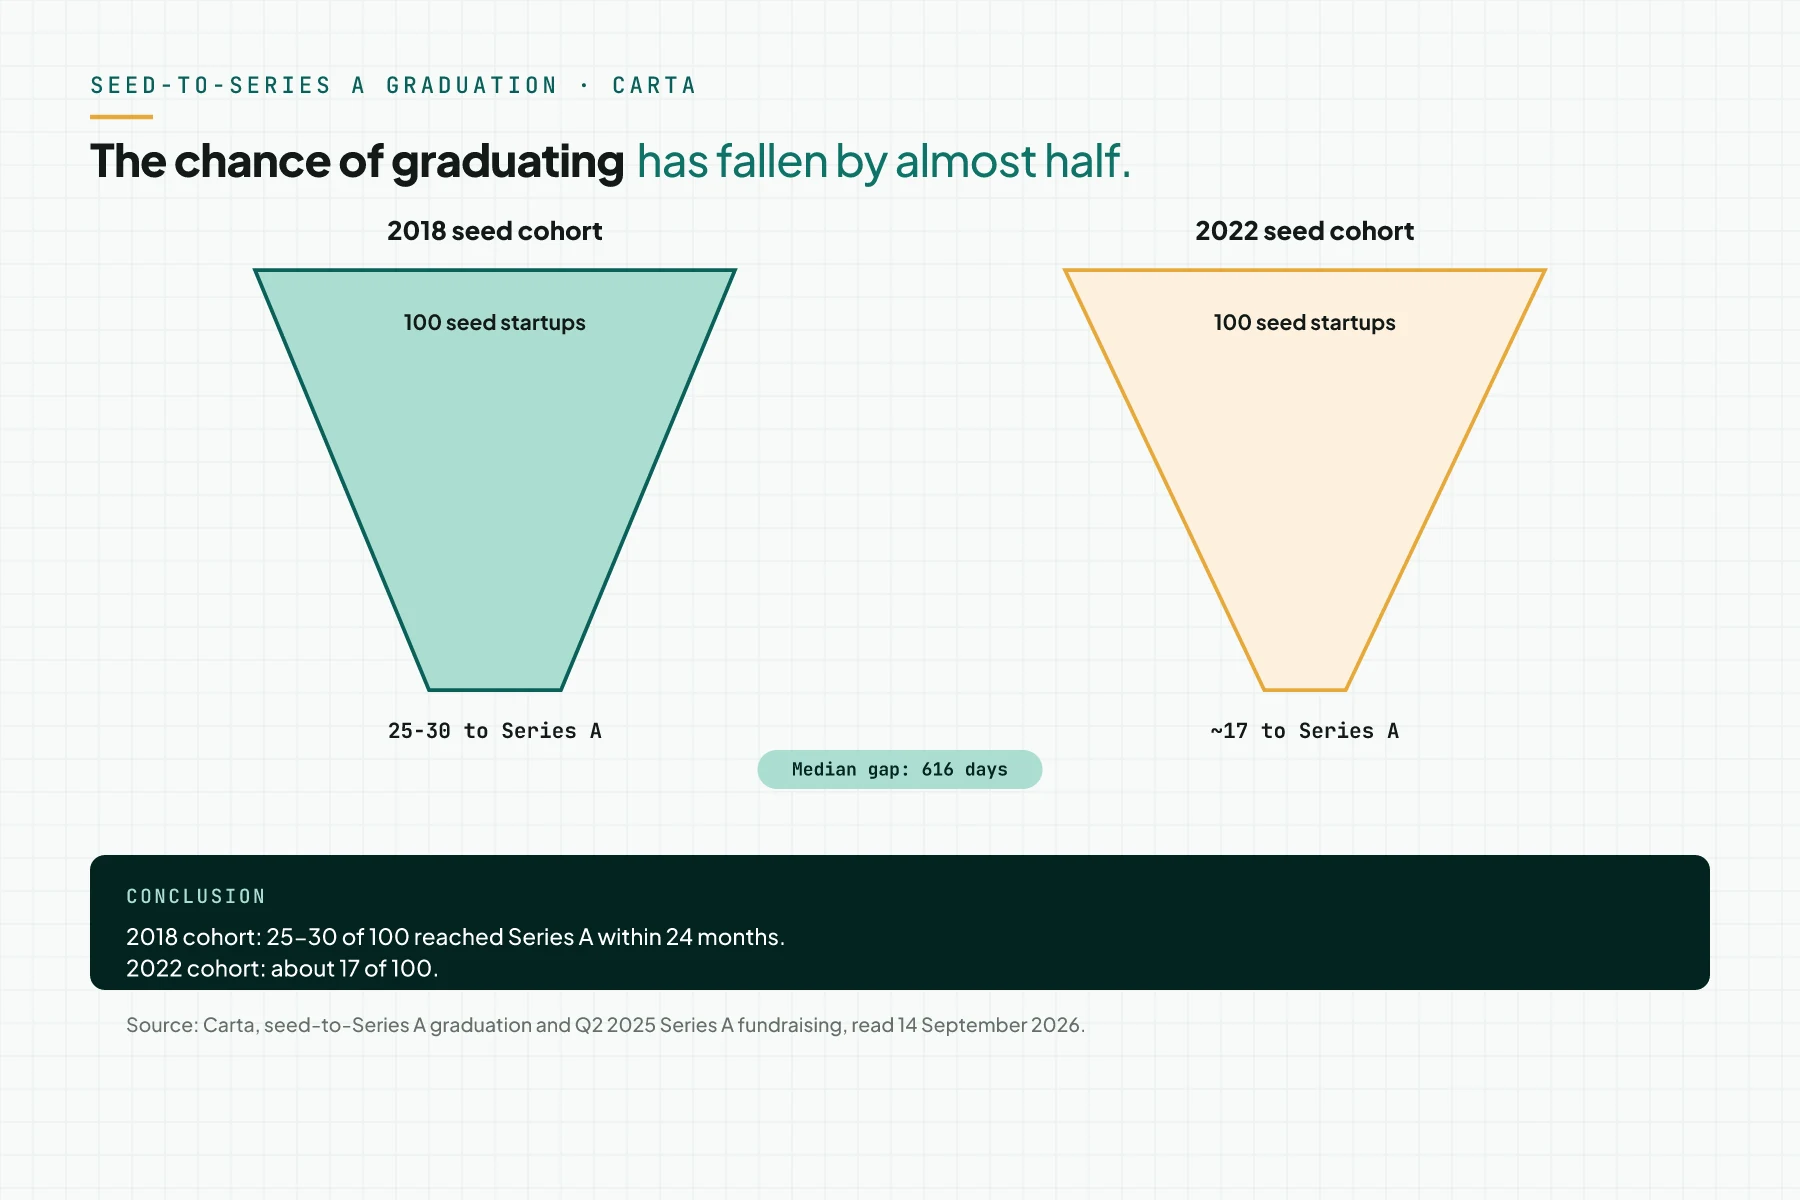
- Only about 17% of the 2022 seed cohort reached Series A within 24 months, versus 25-30% in 2018 (Carta, 5 February 2025).
Startup funding stages: 6 rungs from pre-seed to exit
Startup funding stages traditionally run in order: seed, then Series A, Series B, Series C, until an acquisition or IPO (YC). No round is required; some companies start directly with a Series A equity round (YC). A company's first capital is usually called seed capital.
Cento defines each stage by the proof it reaches, not only elapsed time. Pre-Series A builds the idea and team. Series A proves the product through early, repeatable revenue. Series B builds scale, and Series C and later rounds fund further growth, including pre-IPO (Cento, 2024).
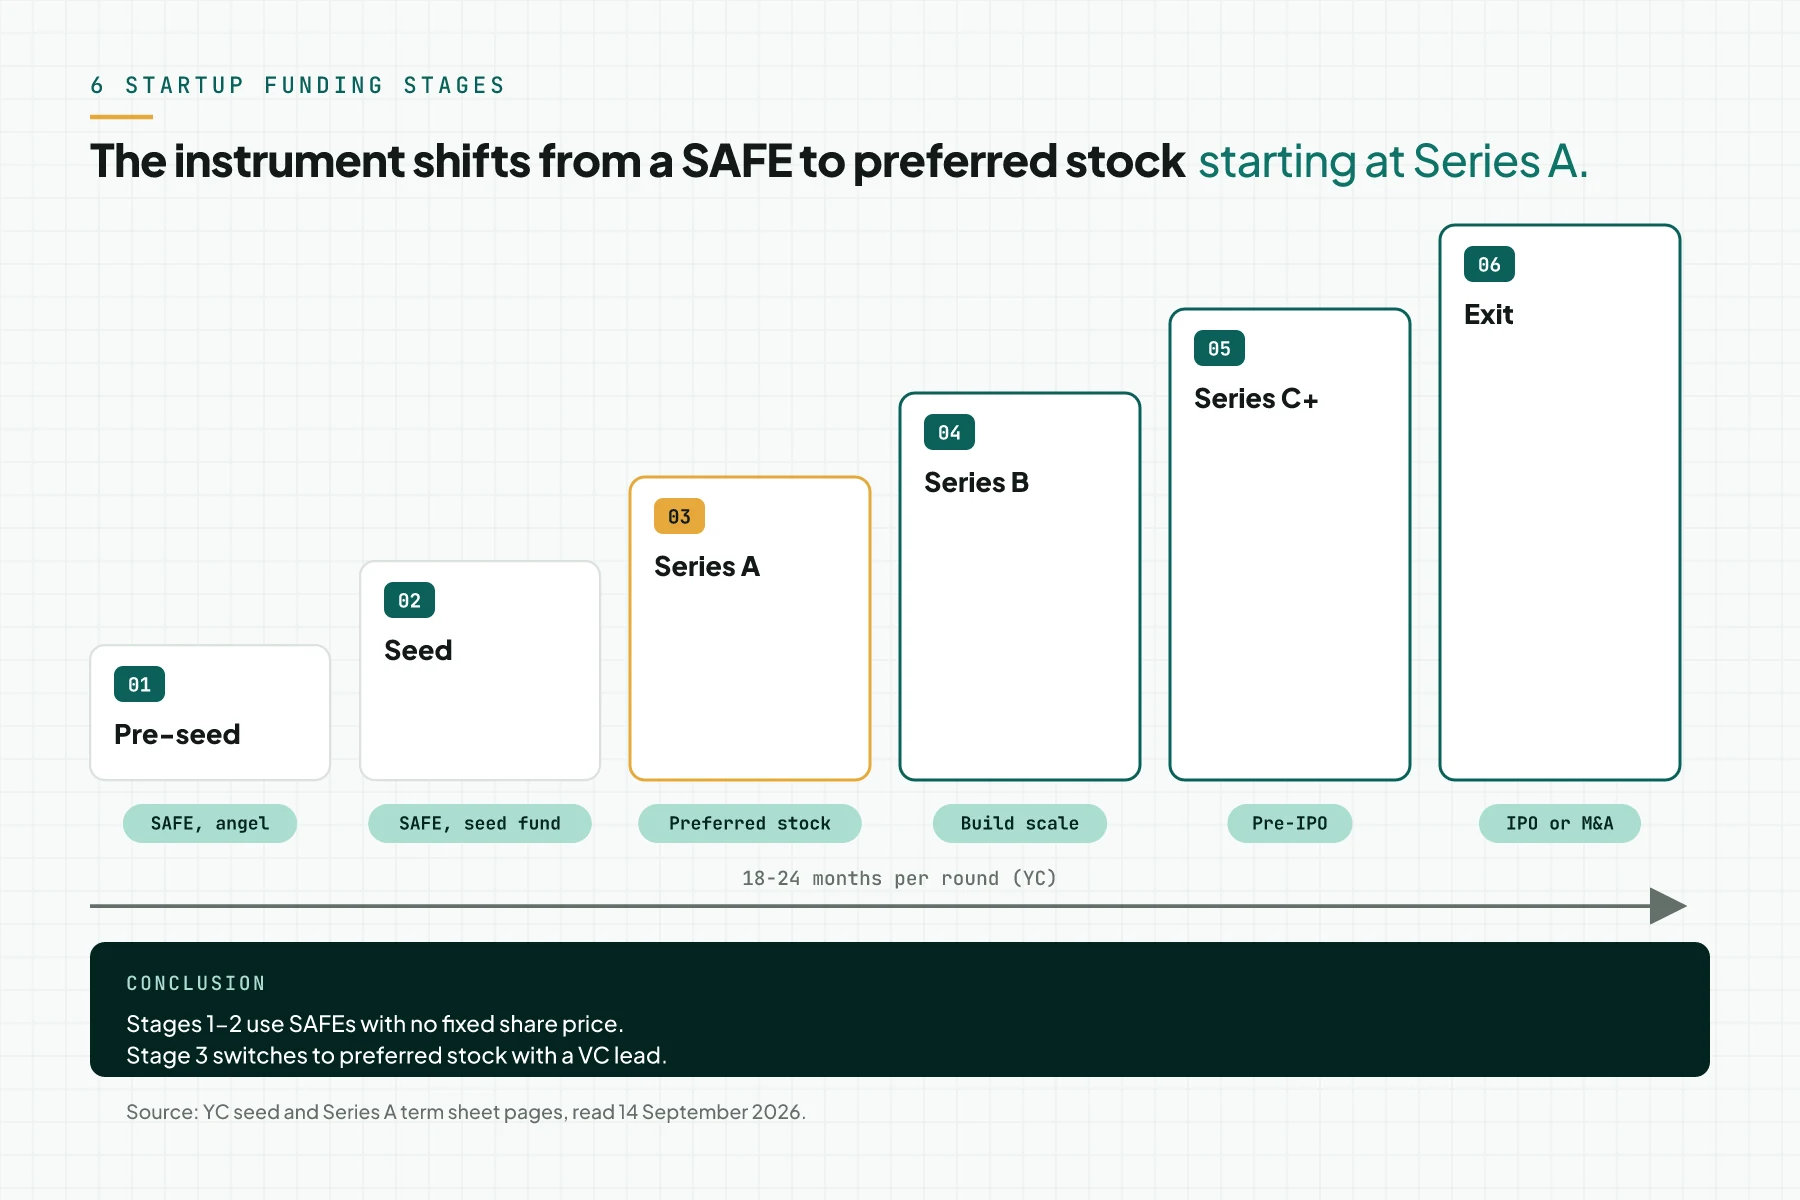
The instrument shifts partway up the ladder. Pre-seed and seed use SAFEs or convertible notes, with SAFEs as the default instrument (Carta). Series A and later sell preferred stock with a clear share price (YC term sheet). YC benchmarks a Series A round 18-24 months after seed (YC).
Read what Series A funding is for the requirements, size, and how to raise a Series A. This article maps every rung, so 1 stage's full definition is not repeated here.
What goes wrong when founders skip a stage or raise too early
The chance of graduating a stage has fallen sharply. In 2018, 25-30% of seed startups reached Series A within 24 months; the 2022 seed cohort was only about 17% (Carta, 5 February 2025). The median seed-to-Series-A gap reached 616 days in Q2 2025 (Carta, 19 September 2025).
Capital is also more concentrated. In 2025, the bottom 50% of US startups that closed a round got only 14% of the cash raised; the top 10% took about half (Carta).
Excess seed dilution adds risk at the next stage. YC's guide states seed dilution can reach 20%; avoid more than 25% (YC).
In Southeast Asia, Series A to early Series B deals fell 50% year on year in 2024; seed and pre-A fell the sharpest (Cento, 2024). Private debt and convertible notes make some recorded valuations look sticky, while priced equity rounds turn rarer (Cento, 2024).
A founder who wins a small niche first builds proof before raising the next stage. Read the wedge market: win a small niche first (Indonesian source) for that order.
Read TAM, SAM, and SOM: meaning, formulas, and examples (Indonesian source) for the market size an investor reads at each stage.
Pre-seed and seed: first capital with SAFEs
Size and valuation
A typical seed round raises $500k to a couple million dollars and can close within weeks using a SAFE (YC). YC's older guide states seed valuations tend to run $2-10M (YC).
Recent Carta data gives a higher median: seed $24.3M on $4.1M raised, at 18% dilution (Carta, 10 July 2026). Seed median post-money valuation rose to $24M in Q4 2025, from $16M 2 years earlier (Carta).
US pre-seed in Q1 2026 involved about 3,000 startups that raised over $2.3B. Convertible notes were only 7% of rounds; SAFEs stayed the default instrument (Carta, 14 May 2026).
Investors and how a SAFE works
Angels invest their own money, usually $25k to $100k or more per company, and typically decide faster than institutional VCs (YC). A SAFE closes 1 by 1 as each investor is ready, with no joint closing (YC SAFE User Guide).
A SAFE converts automatically into preferred stock at the next equity financing, with no interest and no maturity date (YC). The base formula: ownership sold equals investment divided by the post-money valuation cap (YC SAFE User Guide). Read how to calculate Series A valuation and dilution for the full formula and a SAFE conversionConversionThe action you count as a result, for example a paid order, a sign-up, or a chat that becomes a qualified buyer.Open the glossary example.
A founder who wants a picture of cash runway before the next round can read the startup cash-flow J-curve: trough, runway, and turning point.
Series A: the first priced round
Series A sells preferred stock, with a lead investor who usually wants 20% ownership, 18-24 months after seed (YC). The US/global median is $80M on $14.4M raised, at 18% dilution; the Southeast Asia median pre-money is $20.0M with a $4.0M round size (Carta, 10 July 2026; Cento, 2024). Read what Series A funding is for the requirements, investors, and how to raise a Series A; this article does not repeat that.
Series B and Series C: building scale
Series B builds scale, while Series C and later rounds fund further growth, including pre-IPO (Cento, 2024). The US/global Series B median is $191M on $25M raised, with 12% of the company sold (Carta, 10 July 2026).
The Series C median post-money is $391M on nearly $40M raised, under 10% dilution. Series D is $789M on $63M, at 8% dilution (Carta, 10 July 2026).
Dilution falls at each later stage. The Series B median dilution fell from about 15% to 12.9% in 2025; the median across all seed-to-Series-C rounds sits at 16% (Carta, 18 February 2026).
In Southeast Asia, the Series B median pre-money reached $52.0M with an $8.0M round size in 2024 (Cento, 2024). US Series B and Series C pre-money valuations rose 17.2% and 12.5% since early 2025 (Carta, 29 May 2026).
Investor growth targets shrink with scale. Average annual ARR growth reaches 200% at $1-10M ARR, falls to 115% at $10-25M, and 60% at $50-100M (Bessemer). Read the Series A metrics investors read for the full metric set at every stage.
Comparison table of startup funding stages
Table 1 summarises the purpose, instrument, 2-region median, and typical investor at each stage. The data region is named in the column heading, since Carta covers US/global and Cento covers Southeast Asia.
| Stage | Purpose (Cento, YC) | Instrument | US/global median (Carta, 10 July 2026) | Southeast Asia median (Cento, 2024) | Typical investor |
|---|---|---|---|---|---|
| Pre-seed | Build the idea and team | SAFE; convertible notes 7% of US rounds (Q1 2026) | About 3,000 US startups raised over $2.3B (Q1 2026) | Pre-A: valuation about $5M; size $1.0M | Angels ($25-100k+), pre-seed funds |
| Seed | Validate the first product; $500k to a few million (YC) | SAFE (default); sometimes a priced round | Valuation $24.3M on $4.1M; 18% dilution | Cento groups this with Pre-A | Angels, seed funds, syndicates |
| Series A | Proven product; early repeat revenue | Series A preferred stock | Valuation $80M on $14.4M; 18% dilution | Pre-money $20.0M; size $4.0M | Lead VC (usually 20%) |
| Series B | Building scale | Series B preferred stock | Valuation $191M on $25M; 12% sold | Pre-money $52.0M; size $8.0M | Growth VC; existing investors join pro rata |
| Series C+ | Later-stage investment, including pre-IPO | Series C+ preferred stock | C: post-money $391M on nearly $40M, under 10%; D: $789M on $63M, 8% | Not reported | Growth funds, private equity, corporate VC |
| Exit | Liquidity for investors and staff | Share sale or conversion | Q1 2026: 34 IPOs, $9.9B; 2025: 396 tender offers (+62%) | Later-stage deals drove 2025 funding (Bain) | Public markets, acquirers, secondaries buyers |
Table sources: Carta, 10 July 2026, Cento, 2024, Carta, 14 May 2026, and Bain, 11 November 2025.
Exit: IPO, acquisition, tender offers, and why a VC must exit
A VC works with a founder for 3-8 years; the payoff comes only when the company is acquired or lists through an IPO (NVCA). On average, 15% of a VC portfolio's exits are IPOs, and about half are mergers or acquisitions (NVCA).
A VC fund's standard life is 10 years, with an extension option (NVCA). Read the private equity and venture capital J-curve for the investor's cash flow and why a fund must exit before its life ends.
Other liquidity paths are also growing. 2025 recorded 396 tender offers, up 62% from the year before; Q1 2026 saw 34 IPOs raise $9.9B (Carta; Carta, 29 May 2026).
In Southeast Asia, 2025 funding was driven by later-stage deals, while early-stage funding kept contracting (Bain, 11 November 2025). Read what Series A funding is for how an investor sizes the ownership it needs before it invests.
Dummy simulation: founder ownership from pre-seed to Series C
The simulation below uses dummy data, not client data. Month 0 starts in January 2024 with a pre-seed SAFE; month 72 ends in January 2030 at Series C.
| Month | Stage | Input (instrument, dummy amount) | Recorded (share sold) | Output (founder ownership) |
|---|---|---|---|---|
| 0 | Pre-seed | SAFE $300k, post-money cap $3M | 10% (dummy assumption, not a median) | 90.0% |
| 12 | Seed | SAFE $2M | 18% (Carta seed median) | 73.8% |
| 32 | Series A | Preferred stock $14M | 18% (Carta Series A median) | 60.5% |
| 52 | Series B | Preferred stock $25M | 12% (Carta Series B median) | 53.3% |
| 72 | Series C | Preferred stock $40M | 10% (Carta Series C median, rounded) | 47.9% |
This simulation only multiplies (1 - dilution) at each stage, with no option pool and no pro rata right for existing investors; both add dilution. The 12-20 month gap between rounds uses the YC 18-24 month benchmark and the Carta 616-day median.
Carta states its medians are only the middle of a wide range; use them as a guide, since every deal differs (Carta, 10 July 2026). Read how to calculate Series A valuation and dilution for how to calculate dilution with an option pool.
Checklist to decide the next funding stage
- Write the current stage with proof: the latest instrument and its date (founder; dated cap table).
- Write the next milestone with a number: revenue, customers, or product (founder; 1-page document).
- Calculate runway; start the raise process around 8 months of runway, per YC's advice (finance; 12-month cash table).
- Log the relevant region's median with its source date, not a US number for a non-US market (finance; benchmark table).
- Simulate cumulative dilution to Series C with an option pool (finance; spreadsheet labelled as a simulation).
- Weigh non-dilutive options before a new priced round: venture debt, revenue-based financing (founder; decision note).
- Stop criterion (Rama Digital recommendation): if the next milestone is unmet and runway is under 6 months, skip a new priced round. Choose a bridge SAFE or cost cuts instead.
FAQ on startup funding stages
What is seed funding? Seed funding is a startup's first real capital round, typically $500k to a few million dollars. It is usually raised with a SAFE and closes within weeks (YC). The Carta median is $24.3M on $4.1M raised.
What is the difference between pre-seed and seed? Pre-seed builds the idea and team, often with angels (Cento); seed validates the first product. Both usually use SAFEs, though Carta reports pre-seed as a separate, unpriced round.
What is the difference between Series A, B, and C? Series A needs a proven product, at a median $80M. Series B funds scale at $191M. Series C and later fund further growth or a pre-IPO round, at a $391M post-money median (Carta, US/global). Dilution falls from 18% to 12%, then under 10%.
How long is the gap between funding rounds? YC benchmarks 18-24 months; the median seed-to-Series-A gap reached 616 days in Q2 2025 (Carta).
Must a startup go through every funding stage? No. Some companies start directly at Series A (YC); others use venture debt or revenue-based financing alongside or instead of a priced round.
What is a startup exit? A startup exit is liquidity through an IPO, an acquisition, or a tender offer. About 15% of VC exits are IPOs, and about half are M&A (NVCA). Q1 2026 saw 34 IPOs raise $9.9 billion (Carta).
Next step
Rama Digital is not a financial, legal, or tax adviser. This map explains the mechanism, not a recommendation on when to raise. If your team wants to check its current stage, use the AI Diagnostic service. This 60-90 minute session is priced at Rp 1.5 million, and the result is a bottleneck map, AI opportunities, and a written first step. To ask a question first, book a 30-minute session.
Sources
- Y Combinator: A guide to seed fundraising
- Y Combinator: How startup fundraising works
- Y Combinator: Series A Term Sheet Template
- Y Combinator: A standard and clean Series A term sheet
- Y Combinator: How to build a great Series A pitch and deck
- Y Combinator: Safe documents
- Y Combinator: Post-Money Safe User Guide
- Carta: VC Startup Fundraising Benchmarks From 1000 Rounds
- Carta: State of Private Markets, Q1 2026
- Carta: State of Private Markets, 2025 in review
- Carta: State of Pre-Seed, Q1 2026
- Carta: Graduation rate from seed to Series A
- Carta: The new state of Series A fundraising
- Carta: Rising round sizes and record-breaking valuations
- Cento Ventures: Southeast Asia Tech Investment 2023-2024
- Bain and Company: e-Conomy SEA 2025 press release
- NVCA: What is Venture Capital?
- Bessemer Venture Partners: Scaling to $100 Million