Direct answer: Series A metrics investors read fall into 3 groups: growth (ARR, growth rate), retention (NRR, GRR, gross marginGross marginThe share of the selling price left after the cost of goods, written as a percentage.Open the glossary), and efficiency (CAC payback, burn multiple, runway). Investors read a monthly 4–6 month trend, not a cumulative number. US/global benchmarks: average ARR growth 200% at $1–10M ARR, NRR 125–150% for early B2B, and a 2x burn multiple reasonable.
Main condition: this applies to startups with recurring revenue: SaaS, subscription, and B2B. Benchmarks come from Bessemer portfolio data, YC transcripts, a16z, and Sacks, all US/global data. Transaction or project businesses use other metrics. Limit: Rama Digital is not a financial, legal, or tax adviser. This article explains the mechanism and calculation, not a funding promise or result. The ARR "required" for Series A is only investor opinion or a small survey, not a formal rule. This article does not calculate valuation; the formulas live in how to calculate Series A valuation and dilution.
We read a16z, YC Key Startup Metrics, Bessemer Scaling to $100 Million, David Sacks, Brad Feld, Carta, and Point Nine on 14 September 2026. The example numbers in this article are a dummy simulation, not real customer data.
30-second summary:
- ARR holds only recurring components; one-time fees, professional services, and bookings are not ARR (a16z, Bessemer).
- Average ARR growth is 200% at $1–10M ARR; growth endurance is about 70% per year (Bessemer, 2021 portfolio data, US/global).
- NRR of 125–150% is strong for early B2B, 110–120% for mature companies, below 100% signals a problem (YC); gross retention 85–90% (Bessemer).
- Burn multiple = net burn / net new ARR. 2x is reasonable early, 3x or more is a warning, 5x is bad (Sacks, 23 April 2020).
- Runway = cash / monthly net burn; $1M with $100k burn = 10 months (YC). YC advises starting to raise with about 8 months of runway.
Series A metrics: 8 numbers in 3 groups that investors read
Series A metrics fall into 3 groups: growth, retention, and efficiency. Figure 1 maps these 8 numbers with 1 short benchmark for each.
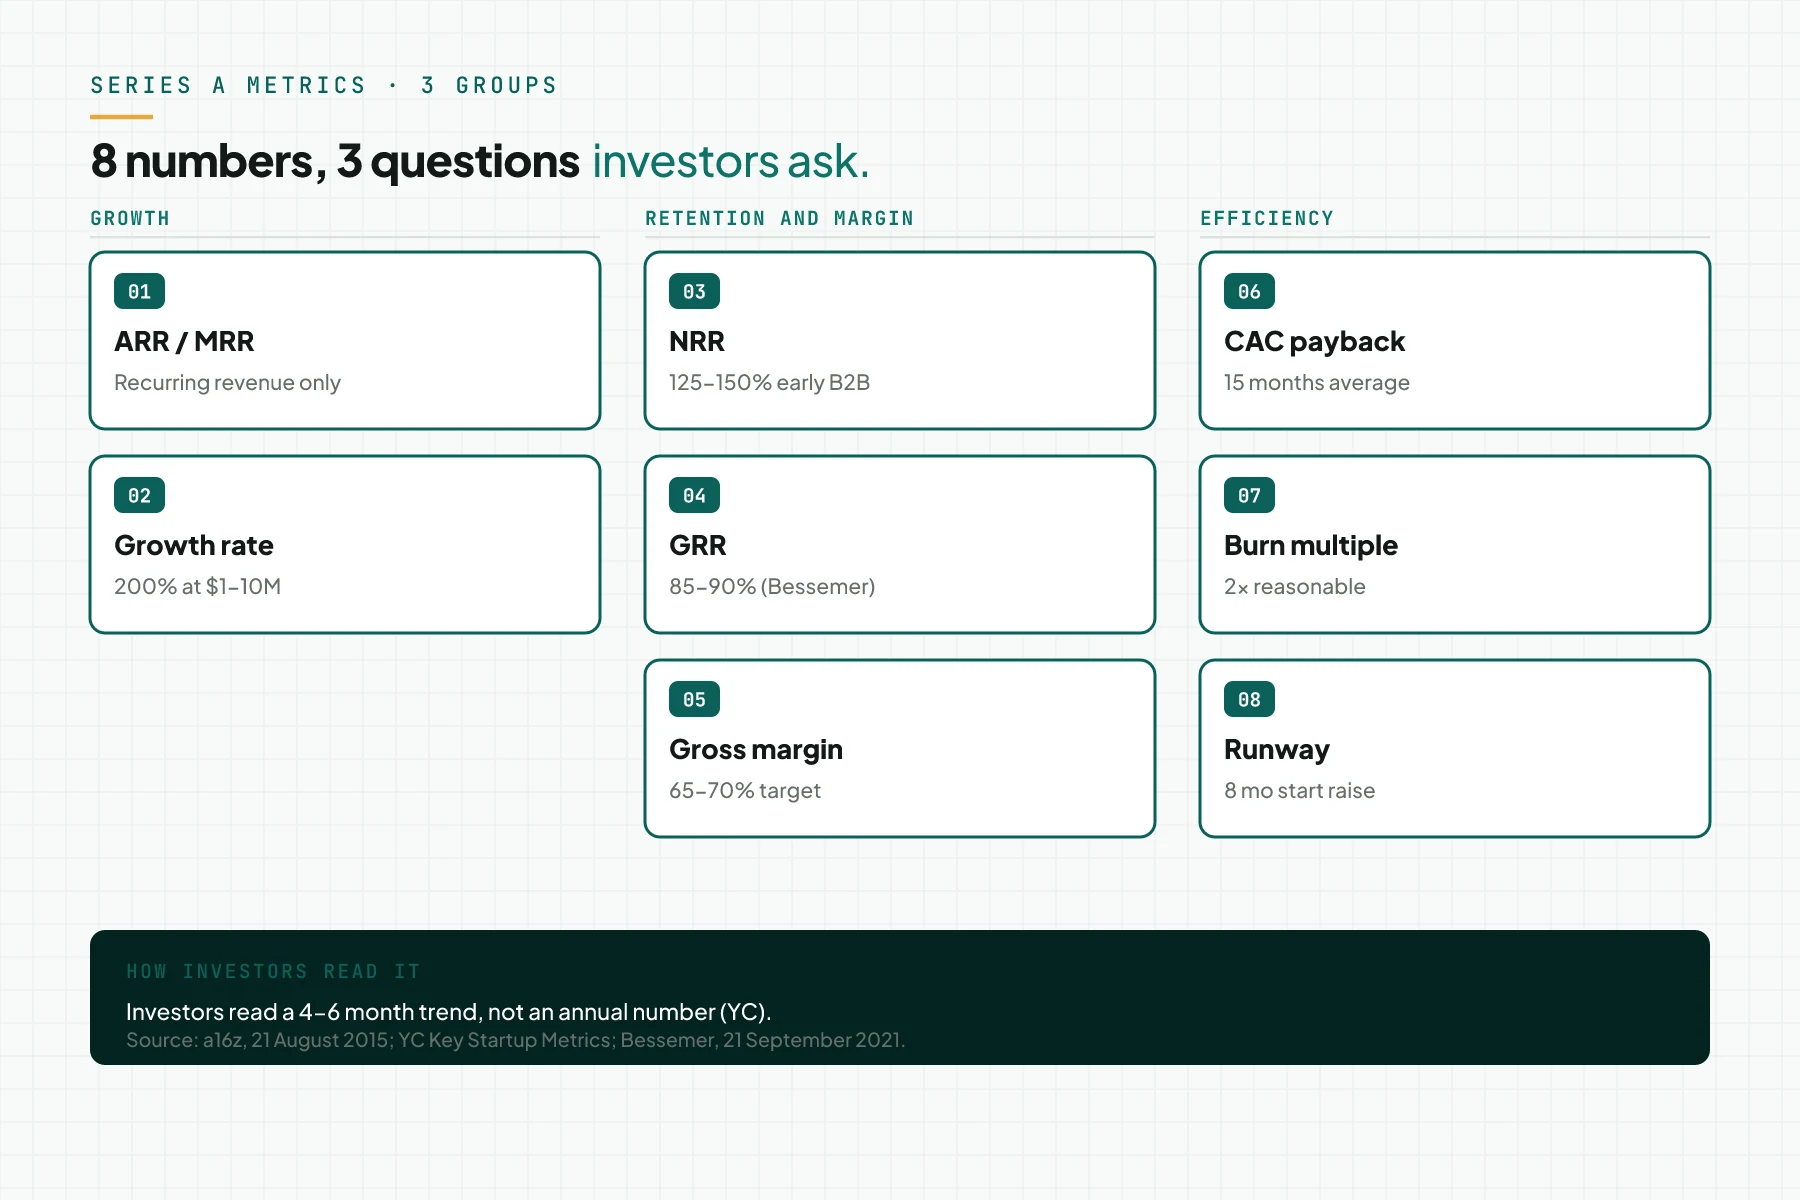
Investors read a 4–6 month monthly trend on a graph, not 1 annual number; a cumulative number hides the real trend (YC, Series A pitch and deck).
Growing 25% a month off a $200k base is easy. Sustaining that rate once MRR reaches $1M is what impresses investors, US/global data from the same source.
Capital efficiency has mattered more since 2023 (Point Nine, SaaS 2023). The ARR "required" for Series A stays opinion, not a rule. Fiat Ventures names $5–10M ARR in an interview with Carta, 19 September 2025, while Point Nine notes a small-survey hypothesis of $2.5–3M and up.
Read what Series A funding is for round size and requirement context. Then read how to calculate Series A valuation and dilution for valuation once metrics are ready.
The problem: numbers investors do not trust
The most common mistake is computing MRR x 12 with non-recurring costs included; setup, hardware, and consulting are not ARR components (a16z, 16 Startup Metrics). Bookings are contract value, revenue is recognised when delivered, and a letter of intent (LOI) is neither.
A cumulative graph hides the real monthly trend (YC). A 5x burn multiple signals an immediate need to cut costs; 3x or more signals product-market fit is weaker than it looks (Sacks, 23 April 2020).
Revenue, COGS, and cash must come from accounting software, not a manual spreadsheet prone to typing errors. Read accounting software as the source of financial numbers (Indonesian source) for this requirement.
Before you write an ARR projection, test bear, base, and bull scenarios in sensitivity analysis and validation of TAM, SAM, SOM (Indonesian source). Only a recurring revenue model produces ARR; project and commission work use other metrics, covered in revenue model vs business model.
Growth: ARR, MRR, and growth rate
ARR and MRR
Annual Recurring Revenue (ARR) and Monthly Recurring Revenue (MRR) measure only the recurring components of revenue (a16z).
Bessemer gives ARR full credit for a running annual contract, and adds Committed ARR (CARR) for signed but not-started contracts (Bessemer, 21 September 2021).
Growth rate
Bessemer records average ARR growth of 200% at $1–10M ARR, falling to 115% at $10–25M, 95% at $25–50M, and 60% at $50–100M (same source).
Growth endurance, the ratio of next year's growth rate to this year's, averages about 70% (same source).
How to read the trend
Investors judge monthly MRR over 6 months, month-over-month growth, and net new ARR per quarter (YC).
Retention and margin: NRR, GRR, and gross margin
NRR
Net revenue retention (NRR) divides today's cohort MRR by that same cohort's MRR at the start of the period. YC also calls it "net dollar retention." A $100k MRR cohort worth $110k a year later gives 110% NRR (YC, Key Startup Metrics).
YC calls 125–150% strong for early B2B, 110–120% good for mature companies, and below 100% trouble; Bessemer reports 105–145% at $1–10M ARR (Bessemer).
GRR and churn
Gross churn divides the MRR lost in a month by the MRR at month start; net churn subtracts upsell first (a16z). Gross revenue retention (GRR) itself stays consistently at 85–90% (Bessemer).
Gross margin
Gross margin divides revenue minus COGS by revenue, averaging 70% with a 65–70% target (Bessemer). Pure SaaS once reached 95%, before AI model costs pushed the figure down (YC). Read gross margin for the full definition.
Efficiency: CAC payback, burn multiple, and runway
CAC and CAC payback
Paid CAC divides paid acquisition cost by new paid-channel customers; blended CAC divides total cost by every new customer (a16z).
CAC is not ad cost per acquisitionCPAThe average cost of 1 result, for example 1 order or 1 qualified buyer.Open the glossary (CPA). Read CPA and conversion for acquisition funnelFunnelThe order of stages a buyer passes, from meeting you to paying you.Open the glossary terms.
Bessemer measures CAC payback against gross-margin-adjusted ARR, averaging 15 months at $1–10M ARR. Targets: SMB under 12 months, mid-market under 18 months, enterprise under 24 months (Bessemer).
Burn multiple
The burn multiple divides net burn by net new ARR in the same period (Sacks, 23 April 2020).
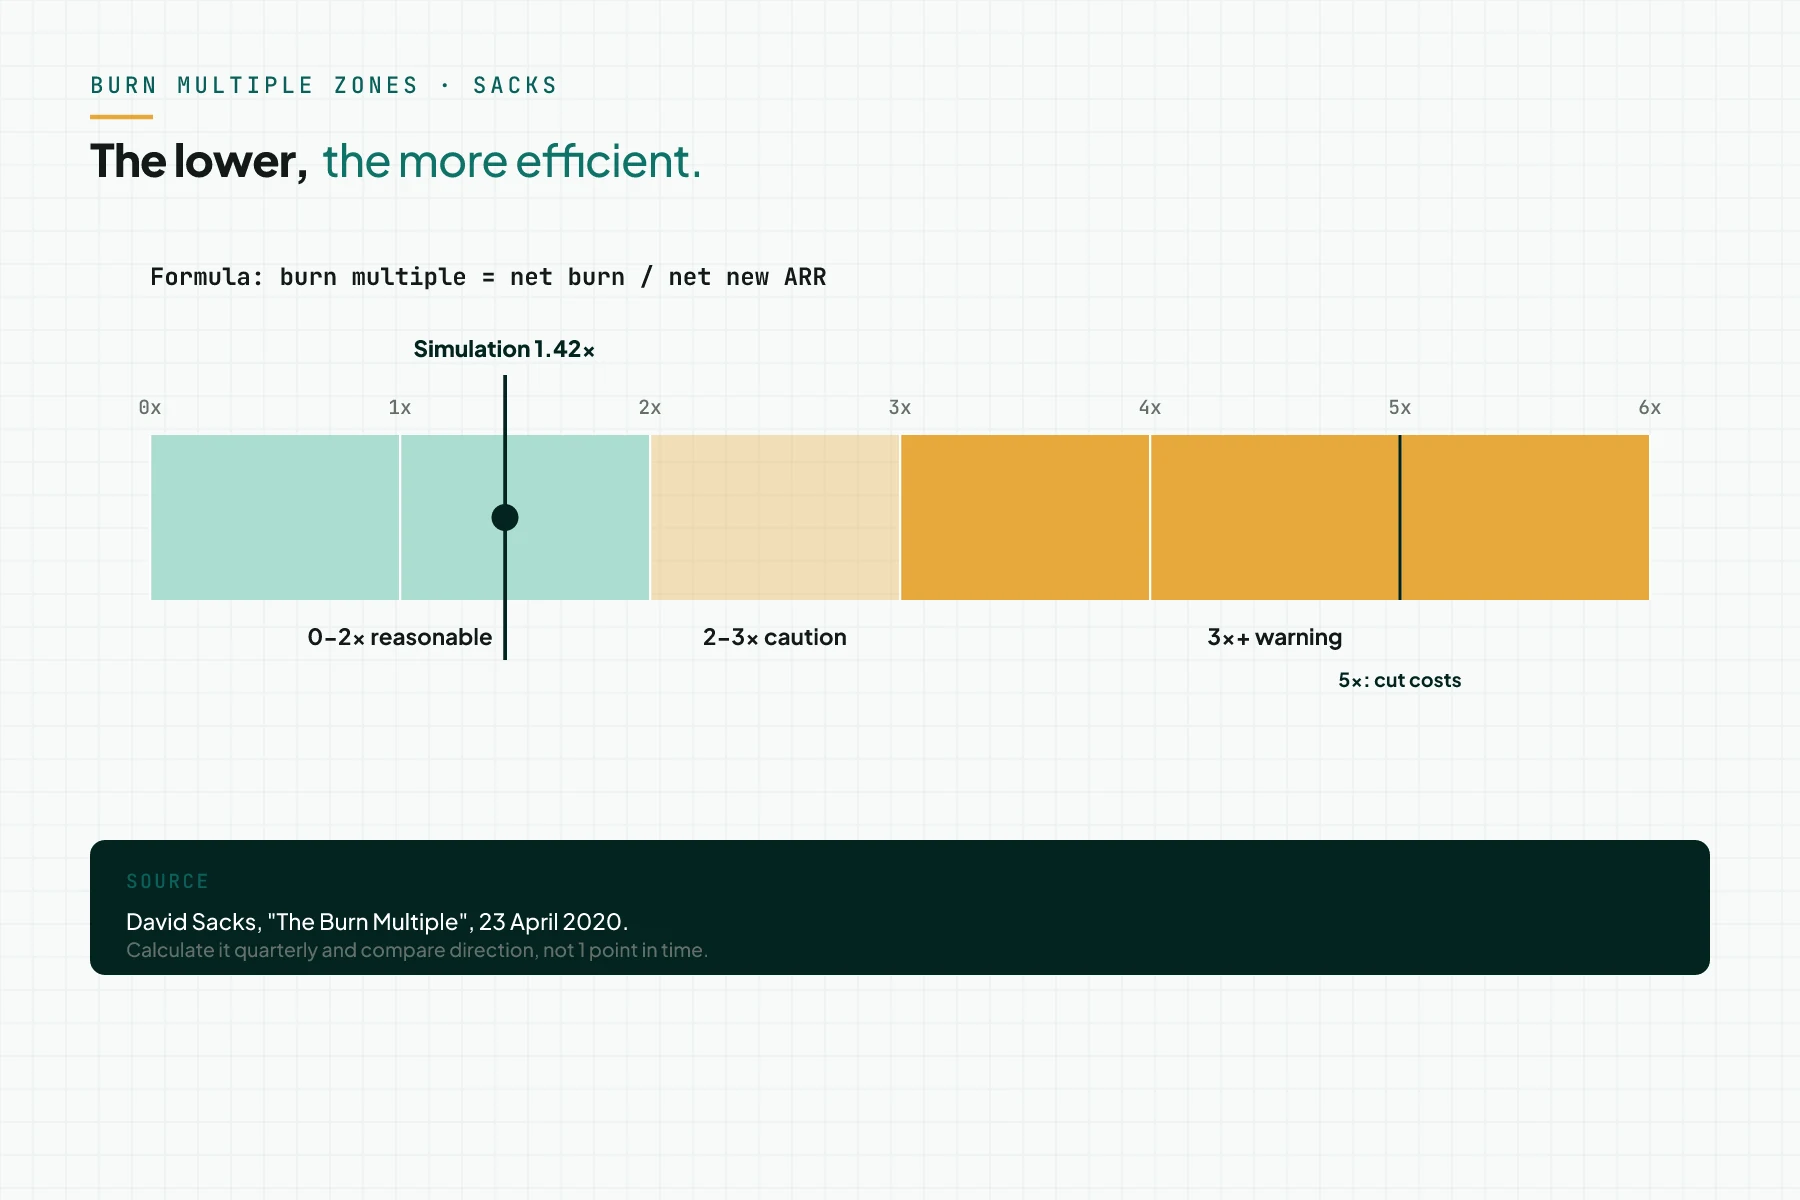
Sacks calls 2x reasonable and 5x bad, needing an immediate cost cut; 3x or more signals weaker product-market fit (same source). This number captures gross margin, sales efficiency, churn, and growth problems at once.
Burn rate and runway
Net burn subtracts revenue from gross burn; investors focus on net burn, not gross burn (a16z).
Runway divides cash by monthly net burn. $1M in cash with a $100k monthly burn gives 10 months of runway (YC).
YC advises raising with about 8 months of runway left (YC, how to spend after a raise). Under 2 months of cash is the point of no return (YC, advice for short runway).
Read the startup cash-flow J-curve: trough, runway, and turning point for how to calculate a startup's cash-flow trough and turning point.
Rule of 40 and efficiency score
The Rule of 40 adds growth rate and profit margin; Feld wrote it for SaaS at $50M scale and above (Feld, 3 February 2015). Bessemer applies a similar efficiency score once ARR passes $25M (Bessemer); neither is a Series A requirement.
Series A metrics table: formula, benchmark, and common mistake
The table below summarises the formula, benchmark, and common mistake for 9 metrics. The last row marks the Rule of 40 as later-stage context, not a requirement.
| Metric | Formula | US/global benchmark (source, year) | Common mistake |
|---|---|---|---|
| ARR / MRR | ARR = annualised recurring revenue; MRR x 12 only for recurring components | ARR gives full credit for running annual contracts; CARR adds committed contracts (Bessemer 2021) | Counting setup, hardware, consulting, bookings, LOIs (a16z 2015) |
| ARR growth rate | Ending ARR / starting ARR − 1, per month or per year | Average 200% at $1–10M ARR; growth endurance about 70% (Bessemer 2021) | Showing a cumulative number, not a 4–6 month trend (YC) |
| NRR | Today's cohort MRR / starting cohort MRR | 125–150% early B2B; 110–120% mature; below 100% a problem (YC); 105–145% (Bessemer) | Mixing new customers into the cohort |
| GRR | (Starting MRR − churn − downgrade) / starting MRR, no upsell | 85–90% (Bessemer 2021) | Calculating GRR above 100% because upsell gets counted in |
| Gross margin | (Revenue − COGS) / revenue | Average 70%; target 65–70% (Bessemer); pure SaaS once reached 95% (YC) | COGS excludes AI model, hosting, and customer support cost |
| CAC payback | CAC / (monthly ARR per new customer x gross margin) | Average 15 months at $1–10M ARR; SMB under 12, mid-market under 18, enterprise under 24 (Bessemer) | Using ad CPA as CAC; missing sales pay and part of customer success |
| Burn multiple | Net burn / net new ARR (same period) | 2x reasonable; 3x or more a warning; 5x bad (Sacks 2020) | Using gross burn instead of net burn |
| Runway | Cash / monthly net burn | $1M / $100k = 10 months; start raising at about 8 months; under 2 months is the point of no return (YC) | Using the lowest month's burn instead of a 3-month average |
| Rule of 40 | Growth rate (%) + profit margin (%) above 40% | For SaaS at $50M scale and above (Feld 2015); Emerging Cloud Index about 50% (Bessemer) | Treating it as a required Series A rule |
Dummy simulation: 6 months of PT Simulasi numbers
The dummy simulation below uses PT Simulasi, April through September 2026, in Rp million. Starting cash Rp 12,000 million; net burn stays at Rp 900 million a month; COGS is 30% of revenue.
| Month | Starting MRR | New MRR | Upsell | Churn | Ending MRR | Growth m/m | Net burn | Ending cash balance |
|---|---|---|---|---|---|---|---|---|
| April | 300 | 40 | 10 | −10 | 340 | 13.3% | 900 | 11,100 |
| May | 340 | 45 | 12 | −12 | 385 | 13.2% | 900 | 10,200 |
| June | 385 | 50 | 14 | −14 | 435 | 13.0% | 900 | 9,300 |
| July | 435 | 55 | 16 | −15 | 491 | 12.9% | 900 | 8,400 |
| August | 491 | 60 | 18 | −17 | 552 | 12.4% | 900 | 7,500 |
| September | 552 | 65 | 20 | −19 | 618 | 12.0% | 900 | 6,600 |
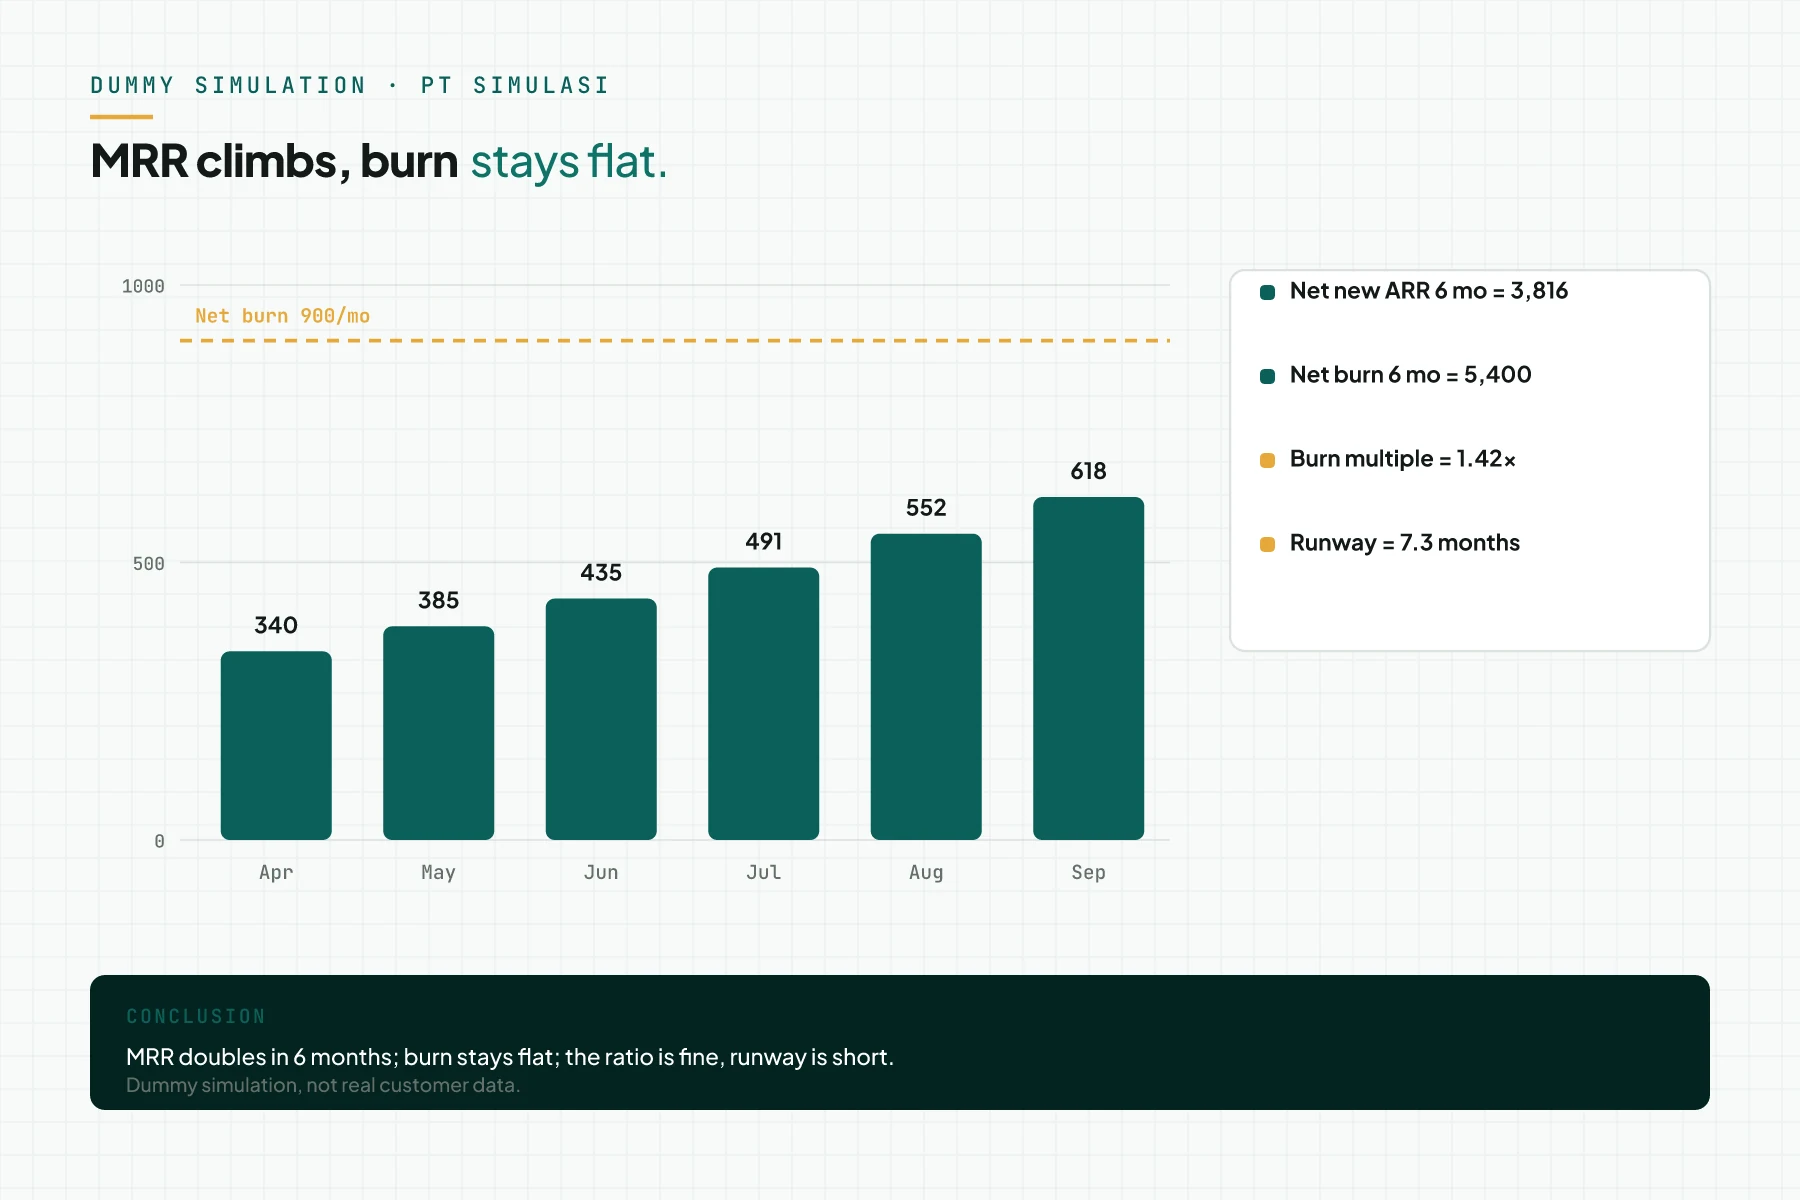
Ending ARR = 618 x 12 = Rp 7,416 million. Net new ARR (6 months) = (618 − 300) x 12 = Rp 3,816 million. Net burn (6 months) = Rp 5,400 million, so burn multiple = 5,400 / 3,816 = 1.42x, inside Sacks' reasonable zone.
Ending runway = 6,600 / 900 = 7.3 months, below YC's 8-month advice; the fundraising process must start now.
The January 2026 cohort gives an NRR and GRR example. MRR of Rp 100 million grows to Rp 112 million by September. Upsell of Rp 20 million and churn of Rp 8 million give 112% NRR and 92% GRR. Gross margin is 70% on Rp 340 million revenue and Rp 102 million COGS. Sales and marketing cost of Rp 480 million for 40 new customers gives a CAC of Rp 12 million. CAC payback = 12 / (1 x 0.7) = 17.1 months, passing the mid-market target but missing the SMB target.
These numbers are a dummy simulation, not real customer data.
How to present Series A metrics to investors
Monthly graphs, not cumulative ones
Show monthly MRR for the last 4–6 months, not a cumulative number (YC).
A cohort table for NRR and GRR
Include a monthly cohort table for NRR and GRR. Separate bookings, recognised revenue, and LOIs so investors do not misread them (a16z).
Tracking that makes CAC believable
A CAC number is only credible when customer-source tracking is correct: GA4GA4The Google analytics tool that records visits and actions on your site as events.What is Google Analytics 4 (GA4)?, PixelPixelA piece of code on a web page that tells the ad platform somebody opened the page or took an action.What is the Meta Pixel?, CAPICAPIA server path that sends conversion data from your system to the ad platform, without depending on the buyer browser.What is the Conversions API (CAPI)?, UTMUTMA label you attach to a page address to mark the source of a visit, for example the campaign and the channel.Open the glossary, and events all recorded cleanly.
Read preparing a Series A pitch deck and data room for the traction slide in a deck once these metrics are ready.
Metrics checklist before you meet investors
- 1-page ARR definition written: recurring components only, no setup, consulting, or bookings (finance; a dated metric-definition document).
- Monthly MRR graph for the last 6 months exported from accounting software, not a manual spreadsheet (finance; export and graph).
- Monthly cohort table for NRR and GRR ready (finance; cohort spreadsheet).
- Gross margin calculated with COGS that includes AI model, hosting, and customer support cost (finance; profit and loss report).
- CAC split into paid and blended; the customer source verified through tracking (marketing; channel report and a tracking audit result).
- The last 2 quarters' burn multiple and today's runway use a 3-month average burn (finance; cash table).
- Every metric has 1 owner and an update date (founder; metrics list).
- Stop criterion: burn multiple 3x or more for 2 quarters, or runway below 8 months. Then stop adding cost and prepare a bridge plan before you pitch.
FAQ on Series A metrics
What are Series A metrics and which do investors read most? Series A metrics span 8 numbers in 3 groups: growth, retention, and efficiency. Investors read a 4–6 month monthly trend, not 1 annual number (YC).
What is the difference between ARR and MRR x 12? ARR equals MRR x 12 only when every component recurs. Setup, hardware, consulting, bookings, and LOIs are not ARR (a16z).
How much ARR is needed for Series A? No fixed rule exists. Fiat Ventures names $5–10M ARR as investor opinion (Carta, 2025). Point Nine notes a small-survey hypothesis of $2.5–3M and up.
What is net revenue retention and what is a good figure? NRR divides today's cohort MRR by the starting cohort MRR. YC calls 125–150% strong for early B2B and below 100% a warning sign, while Bessemer reports 105–145% at $1–10M ARR.
What is the burn multiple and what is reasonable? The burn multiple divides net burn by net new ARR in the same period. Sacks (23 April 2020) calls 2x reasonable, 3x or more a warning, and 5x bad; this article's simulation gives 1.42x.
Does the Rule of 40 apply to a Series A startup? The Rule of 40 is not a Series A requirement. Feld (2015) wrote it for SaaS at $50M scale and above. Bessemer applies a similar efficiency score once ARR passes $25M.
Next step
Rama Digital is not a financial, legal, or tax adviser; a licensed adviser must review every funding and valuation decision.
A CAC or conversionConversionThe action you count as a result, for example a paid order, a sign-up, or a chat that becomes a qualified buyer.Open the glossary number is only correct when the tracking behind it is correct. Use the Data Health Audit service (1 week, Rp 5 million) to check GA4, Pixel, CAPI, UTM, and events, then get a data-gap list and fix priorities. To ask a question first, book a 30-minute session.
Sources
- a16z: 16 Startup Metrics
- Y Combinator: Key Startup Metrics
- Bessemer Venture Partners: Scaling to $100 Million
- David Sacks: The Burn Multiple
- Brad Feld: The Rule of 40% For a Healthy SaaS Company
- Y Combinator: How to build a great Series A pitch and deck
- Carta: The new state of Series A fundraising
- Point Nine: What Does It Take to Raise Capital, in SaaS, in 2023?
- Y Combinator: How much should you spend after fundraising
- Y Combinator: Advice for companies with less than 1 year of runway