
Direct answer: the startup J-curve is the cumulative cash-flow chart that falls while gross burn exceeds cash inflow, then rises once inflow passes gross burn. Calculate 3 numbers per month: net cash flow, cumulative cash flow, and cash balance. The cumulative trough is the peak funding need. Add a reserve, then test 20% lower inflow before you set the amount to raise.
Main condition: this method applies to a startup with fairly fixed monthly costs and gradually growing inflow. It uses monthly numbers from at least 3 months of books. A seasonal business needs different rows per month, not a linear formula. Limit: the duration benchmarks (18–24 month rounds, start raising at about 8 months of runway, 3–6 months of cash) are YC and Investopedia guidance for the US market, not Indonesian data. The simulation uses dummy data, and Rama Digital is not a financial, legal, or tax adviser. This article explains the mechanism and the calculation. A licensed legal and financial adviser must review every funding, valuation, and agreement decision, and there is no promise of funding or results.
We read Investopedia, the Y Combinator Library, and 1 SSRN paper on the venture capital J-curve on 14 September 2026. The example numbers in this article are a dummy simulation, not customer data.
- Runway = cash divided by monthly net burn; Investopedia example: US$1,000,000 divided by US$100,000 equals 10 months (US data, updated April 11, 2026).
- Dummy simulation: opening cash Rp1,200 million, gross burn Rp200 million monthly; trough -Rp900 million in months 9–10, break-even month 10, turning point month 19.
- Sensitivity test: 20% lower inflow moves the trough to -Rp1,152 million in month 12 (cash balance Rp48 million) and the turning point to month 24.
- Y Combinator: an average funding round lasts 18–24 months; start raising with about 8 months of runway left (US/global data).
- Y Combinator: less than 2 months of cash is the point of no return; payroll is the largest burn source.
The startup J-curve: cumulative cash flow falls before it rises
The startup J-curve is the name for a startup's cumulative cash-flow chart: it falls first, then climbs back past its starting point. Its shape depends on investors' capacity to fund long periods of negative cash flow (Hellmann, Montag, and Tåg, SSRN 2026).
This general definition applies in 4 contexts: startup cash flow, private equity and venture capital funds, digital transformation, and the trade balance. Read what the J-curve is for all 4; this article deepens only the startup cash-flow context.
The startup J-curve comes from burn rate, the pace a company spends cash before it turns a profit (Investopedia, Burn Rate). Gross burn is operating cost for 1 month; net burn is gross burn minus net cash inflow. The death valley curve is the same cash curve seen from the risk side: operating with no revenue yet (Investopedia, Death Valley Curve). Read J-curve vs hockey stick vs death valley curve to compare its shape with the hockey stick and the S-curve.
The problem: runway is calculated from today's cash, not from the trough
The most common runway formula, cash divided by monthly cost, ignores growing cash inflow and ignores the month when the balance is lowest (Investopedia, Burn Rate).
The result: many founders raise too late. Y Combinator calls less than 2 months of cash the point of no return, and names over-hiring as the usual root cause of high burn (Y Combinator, Advice for Companies with Less Than 1 Year of Runway).
The longer a startup operates with no revenue, the higher its chance of early failure. Investopedia example (US data): a US$5 million raise spent over 3 years needs at least US$125,000 in revenue within 4 months after (Investopedia, Death Valley Curve).
The monthly numbers for this method must come from the books, not from pitch-deck projections. Read accounting software as the source of finance numbers (Indonesian source) for the source of inflow and operating-cost figures.
Burn multiple, net revenue retention, and other Series A investor metrics are covered in the Series A metrics investors read.
The formulas: gross burn, net burn, runway, cumulative cash flow
Gross burn is operating cost for 1 month; net burn is gross burn minus net cash inflow (revenue minus COGS): NB = GB - (R - COGS) (Investopedia, Burn Rate).
Runway = cash divided by monthly net burn. CF_n (net cash flow for month n) = inflow minus outflow that month. Cum_n (cumulative cash flow) = the sum of CF_1 through CF_n. The trough is the minimum Cum_n; monthly break-even is the first CF_n >= 0; the turning point is the first Cum_n >= 0.
Investopedia example (US data): gross burn US$30,000, revenue US$20,000, COGS US$10,000, so net burn is US$20,000. Cash of US$100,000 then gives a 5-month runway on net burn, not about 3 months on gross burn (Investopedia, Burn Rate). COGS sets net cash inflow; read gross margin for its definition.
Table 1 compares 3 ways to calculate runway, opening cash Rp1,200 million.
| Method | Formula | Simulation result | What it ignores | When to use it | Source |
|---|---|---|---|---|---|
| Gross runway | cash divided by gross burn | 1,200 / 200 = 6 months | cash inflow | month 1 with no revenue | Investopedia, Burn Rate |
| Net runway | cash divided by this month's net burn | 1,200 / 180 = 6.7 months | next month's growth | a routine report | Investopedia, Burn Rate |
| Runway from the trough | opening cash minus the trough's absolute value | Rp300 million left in months 9–10 = 1.5 months of gross burn | none; needs a monthly inflow assumption | setting the amount to raise | calculated in Step 3 |
Payback period is the time to recover an investment's cost, ignoring the time value of money (Investopedia, Payback Period). Break-even is the sales level where revenue equals total costs (Investopedia, Breakeven Point).
Prerequisites: 3 monthly numbers and 1 spreadsheet
Prepare these before you calculate.
- An export of the last 3 months of books: cash inflow, COGS, and operating costs.
- 1 empty spreadsheet with columns for month, net inflow, gross burn, net cash flow, cumulative, and cash balance.
- The opening cash balance as of a stated date.
- 1 number owner: the finance lead.
- 1 monthly inflow growth assumption, written down with its basis.
Without 3 months of data, label the input "assumption" and run the 2-way sensitivity test in Step 5.
Step 1: Record net cash inflow and gross burn per month
Open the books export from the prerequisites. Fill the net inflow column (revenue minus COGS) and the gross burn column (total operating cost) for every month.
Dummy simulation: net inflow for month n = 20 x n million, gross burn stays Rp200 million a month.
Evidence: the 3-month gross burn total matches the cash-flow statement's total spend; a mismatch means a missing cost.
Payroll is the largest burn source (Y Combinator, Advice for Companies with Less Than 1 Year of Runway); keep it on its own row so Step 5 can test it.
Step 2: Calculate net cash flow, cumulative cash flow, and cash balance
Add 3 new columns to the same spreadsheet: net cash flow (CF_n = net inflow minus gross burn), cumulative cash flow (Cum_n = the prior Cum plus CF_n), and cash balance (opening cash plus Cum_n).
Month 1 in the simulation: 20 - 200 = -180; cumulative -180; balance Rp1,020 million. Month 10: 200 - 200 = 0; cumulative -900; balance Rp300 million.
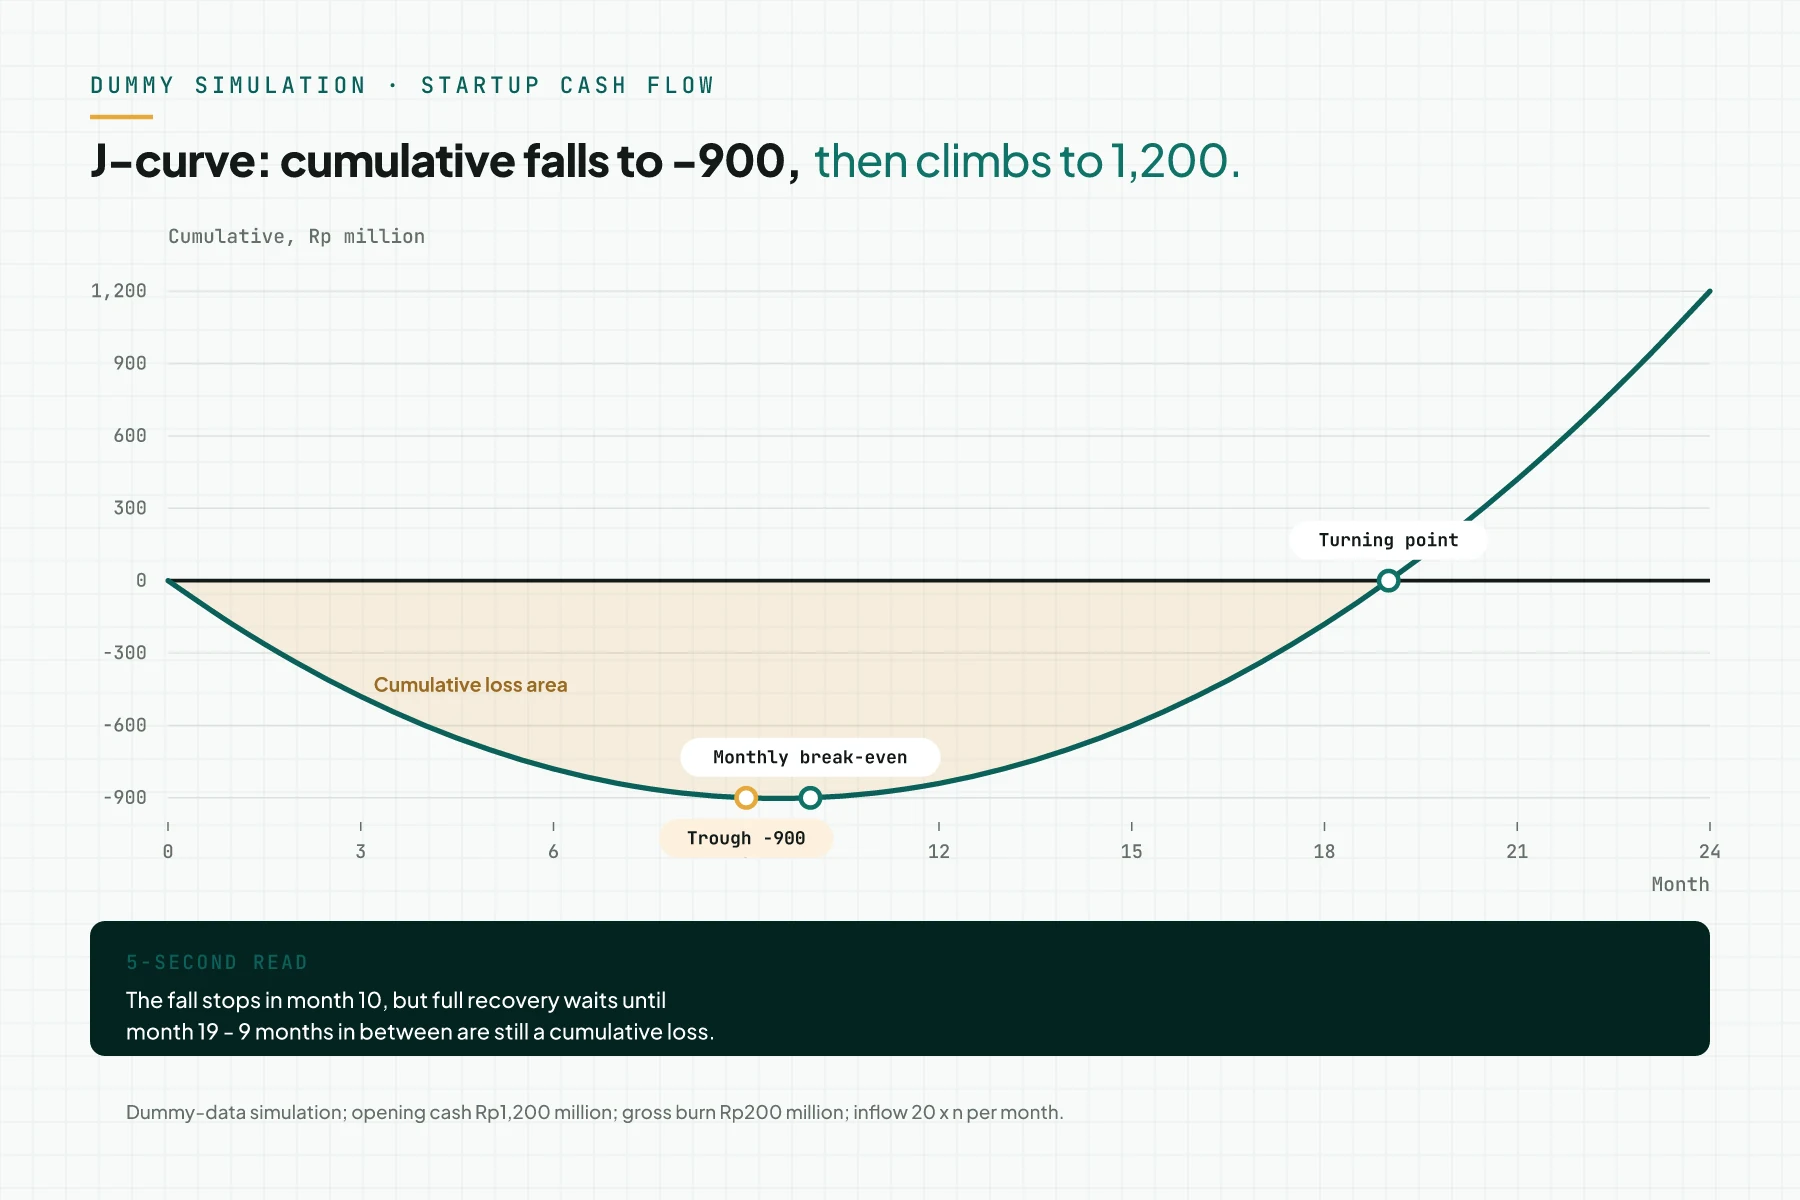
Evidence: the final balance equals opening cash plus the sum of every net cash flow. Here, cumulative cash flow in month 24 equals Rp1,200 million.
Step 3: Mark the trough, monthly break-even, and turning point
Find the minimum value in the cumulative column; that is the trough. Also mark the first month with net cash flow >= 0 (break-even) and the first month with cumulative >= 0 (the turning point).
In the simulation: the trough is -Rp900 million in months 9 and 10; break-even is month 10; the turning point is month 19.
Reading it: the fall stops in month 10, but cash only recovers in full by month 19. The 9 months in between are still a cumulative loss.
Evidence: monthly break-even always falls on or before the trough month plus 1; if not, the net-cash-flow column has a sign error (Investopedia, Breakeven Point).
Step 4: Calculate the peak funding need, reserve, and danger zone
Calculate the peak funding need: the trough's absolute value, Rp900 million in this simulation. Opening cash of Rp1,200 million leaves Rp300 million at the trough, equal to 1.5 months of gross burn.
Investopedia cites a general recommendation to hold cash for 3 to 6 months of expenses (US data). That is Rp600 million to Rp1,200 million at this gross burn, above the simulation (Investopedia, Burn Rate).
Y Combinator marks cash under 2 months of cost as the danger zone, Rp400 million here. The balance sits under that line from month 7 to month 12 (Y Combinator, Advice for Companies with Less Than 1 Year of Runway).
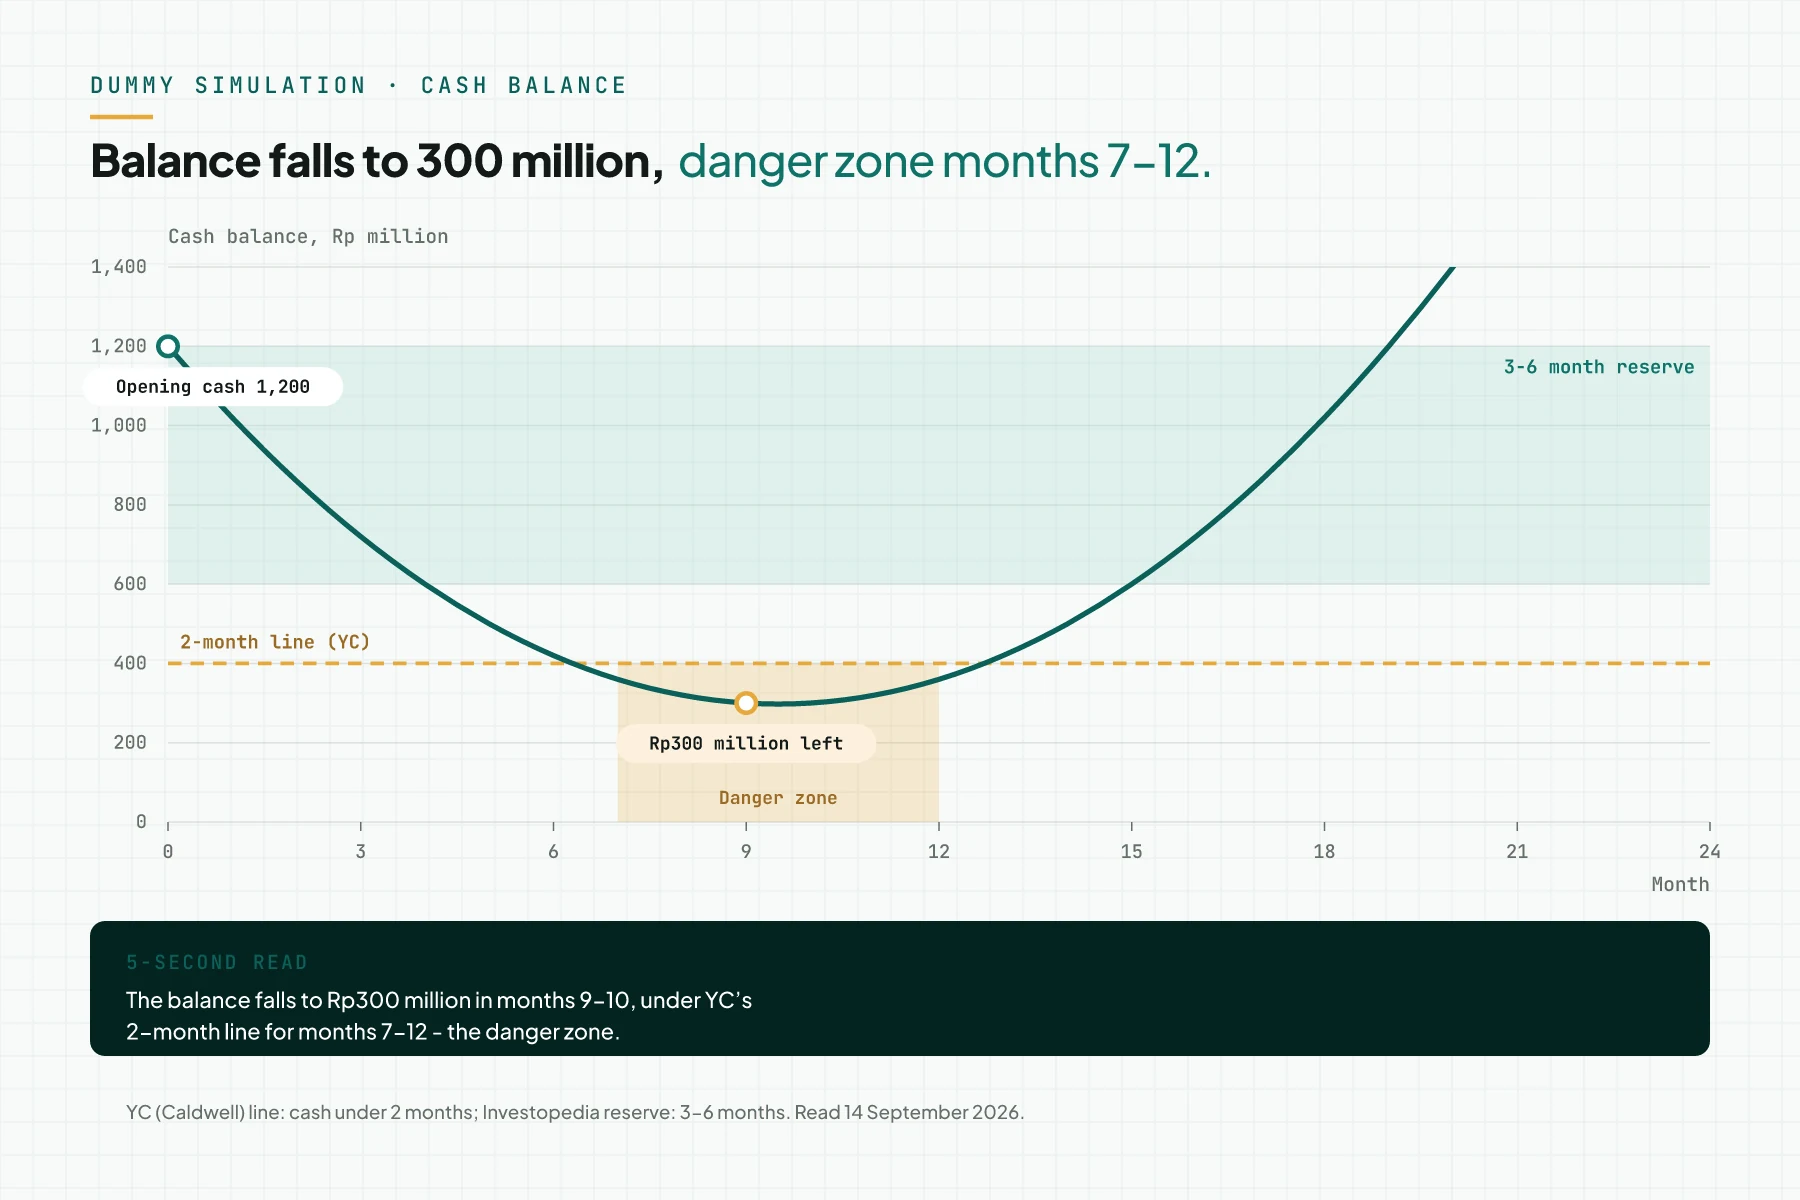
Y Combinator advises starting to raise with about 8 months of runway left (Y Combinator, How Much Should You Spend After Fundraising?), for 12 to 18 months to the next milestone (Y Combinator, A Guide to Seed Fundraising). An average round lasts 18–24 months, US guidance, not Indonesian data.
Evidence: write the peak funding need plus reserve as 1 dated figure. It sets the size of a Series A round; read what Series A funding is for the next step.
Step 5: Run a sensitivity test with 20% lower inflow
Copy the simulation table, change net inflow to 16 x n, and recalculate net cash flow, cumulative, and balance.
Result: the trough is -Rp1,152 million in month 12 (balance Rp48 million), monthly break-even in month 13, the turning point in month 24. The balance sits under Rp400 million from month 6 to month 18.
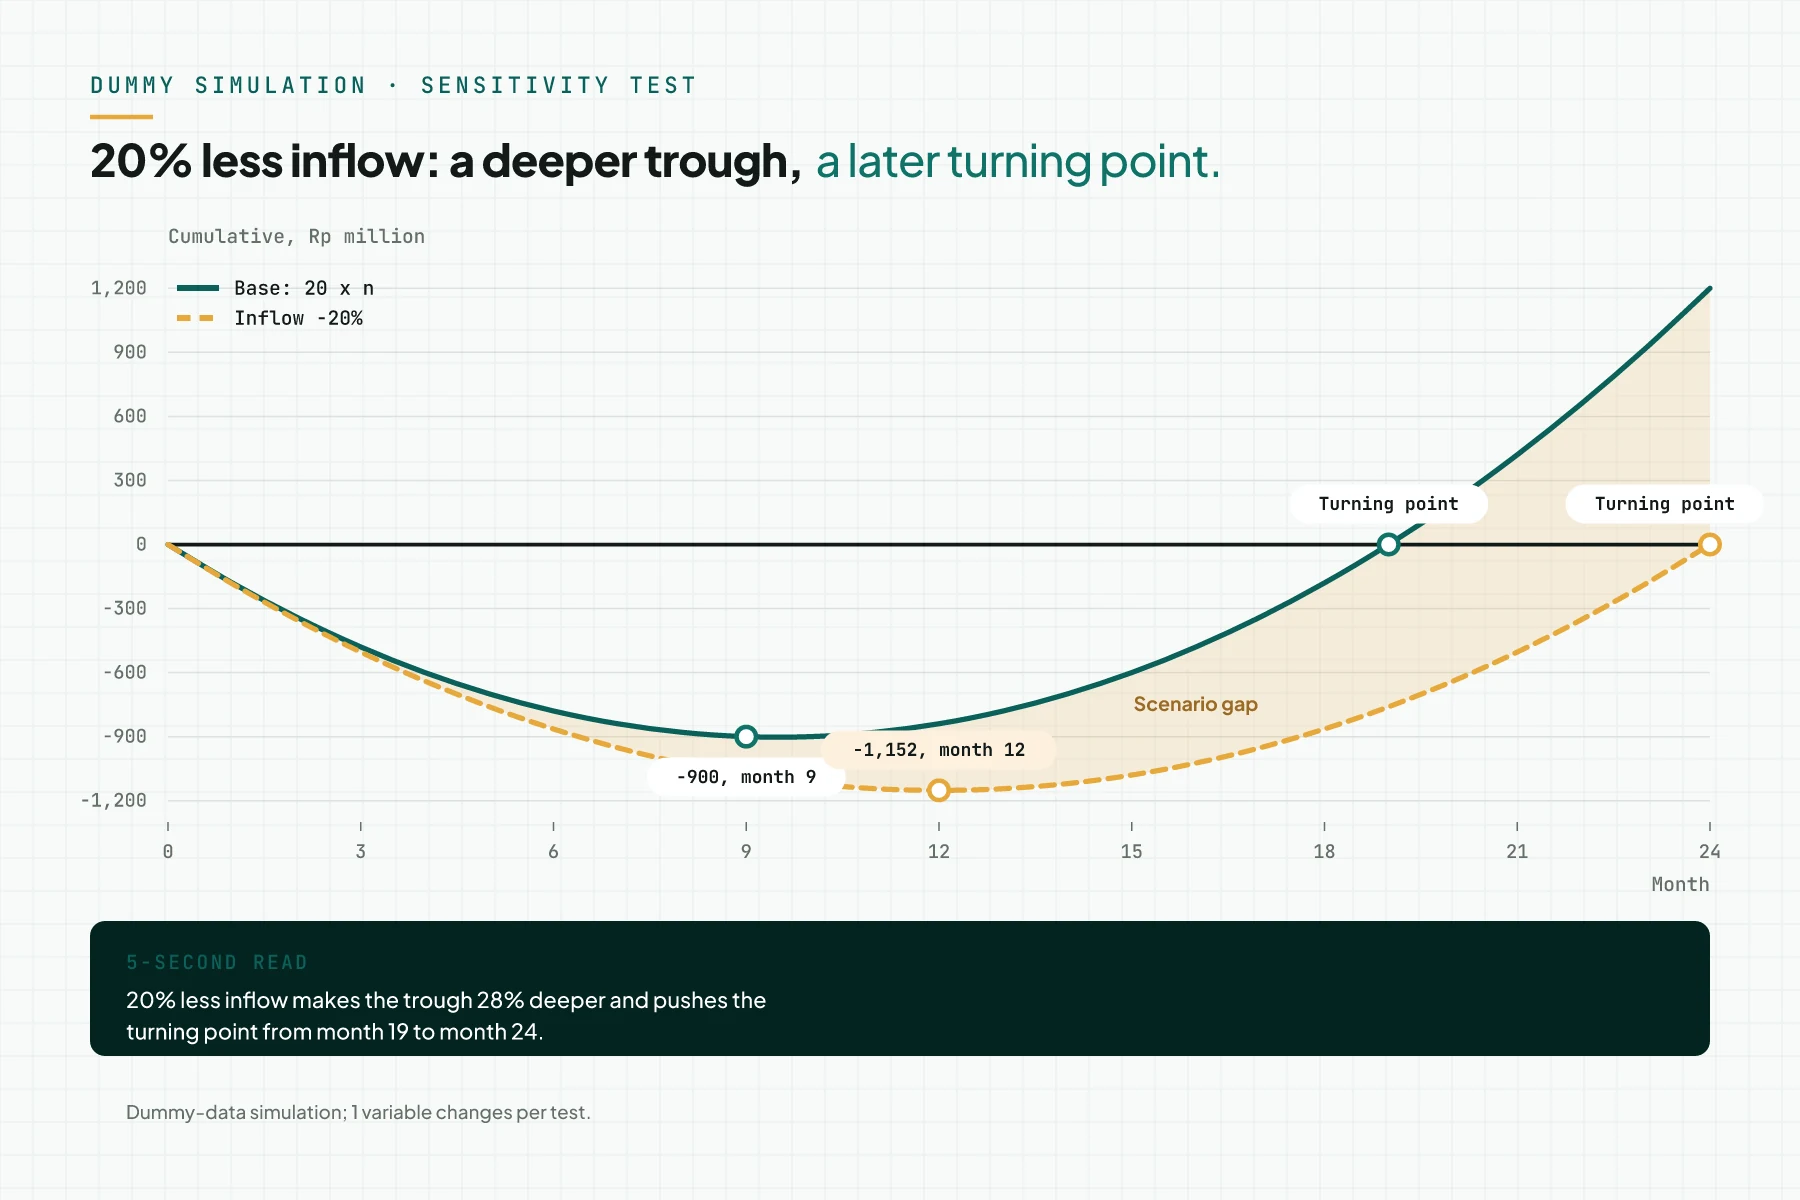
Reading it: 20% lower inflow makes the trough 28% deeper and pushes the turning point back 5 months. That is why Step 4's reserve is 3 to 6 months.
Second test (optional): raise gross burn 10% for payroll, then recalculate. Read sensitivity analysis and bear, base, bull scenarios (Indonesian source) for the bear, base, and bull scenario framework.
Evidence: both scenarios use the same opening cash and gross burn; only 1 variable changes per test.
Full worked example: 24 months (dummy data)
Table 2 is a dummy simulation made on 14 September 2026: months 1 through 20, then month 24. Month 1 is October 2026; month 24 is September 2028.
| Month | Net inflow (Rp million) | Gross burn (Rp million) | Net cash flow (Rp million) | Cumulative (Rp million) | Cash balance (Rp million) |
|---|---|---|---|---|---|
| 1 | 20 | 200 | -180 | -180 | 1,020 |
| 2 | 40 | 200 | -160 | -340 | 860 |
| 3 | 60 | 200 | -140 | -480 | 720 |
| 4 | 80 | 200 | -120 | -600 | 600 |
| 5 | 100 | 200 | -100 | -700 | 500 |
| 6 | 120 | 200 | -80 | -780 | 420 |
| 7 | 140 | 200 | -60 | -840 | 360 |
| 8 | 160 | 200 | -40 | -880 | 320 |
| 9 | 180 | 200 | -20 | -900 | 300 |
| 10 | 200 | 200 | 0 | -900 | 300 |
| 11 | 220 | 200 | 20 | -880 | 320 |
| 12 | 240 | 200 | 40 | -840 | 360 |
| 13 | 260 | 200 | 60 | -780 | 420 |
| 14 | 280 | 200 | 80 | -700 | 500 |
| 15 | 300 | 200 | 100 | -600 | 600 |
| 16 | 320 | 200 | 120 | -480 | 720 |
| 17 | 340 | 200 | 140 | -340 | 860 |
| 18 | 360 | 200 | 160 | -180 | 1,020 |
| 19 | 380 | 200 | 180 | 0 | 1,200 |
| 20 | 400 | 200 | 200 | 200 | 1,400 |
| 24 | 480 | 200 | 280 | 1,200 | 2,400 |
The trough, -Rp900 million, appears in months 9 and 10. Monthly break-even falls in month 10, and the turning point falls in month 19, when cumulative cash flow returns to 0.
Checklist before you set the amount to raise
- Export cash inflow, COGS, and operating costs for the last 3 months from the books (owner: finance; evidence: dated export file).
- Fill a 24-month spreadsheet with net inflow, gross burn, net cash flow, cumulative, and balance columns (owner: finance; evidence: spreadsheet labelled dummy data).
- Mark the trough, monthly break-even, and turning point with calendar months (owner: finance; evidence: 3 coloured cells and 1 chart).
- Write the peak funding need = the trough's absolute value plus a reserve of 3–6 months of gross burn (owner: founder; evidence: 1 dated rupiah figure).
- Mark the months when the balance is below 2 months of gross burn, and set a fundraising date before them (owner: founder; evidence: a date on the team calendar).
- Run 2 sensitivity tests: inflow -20% and payroll +10% (owner: finance; evidence: 2 tables with 1 variable changed).
- Review the numbers with a licensed adviser before an investor meeting (owner: founder; evidence: review notes).
- Stop criterion: if the -20% case pushes the balance below 0 before the fundraising date, stop hiring and cut gross burn (return to item 4).
Startup J-curve FAQ
What is the startup J-curve? The cumulative cash-flow chart that falls while gross burn exceeds cash inflow, then rises past 0; its trough is the peak funding need.
What is the difference between gross burn and net burn? Gross burn is total monthly operating cost. Net burn is gross burn minus net cash inflow; Investopedia example: US$30,000 minus (US$20,000 minus US$10,000) equals US$20,000.
How do I calculate runway correctly? For a routine report, use cash divided by net burn; to set the amount to raise, use the cumulative trough plus a reserve (Table 1).
When should a startup start raising? Y Combinator advises starting with about 8 months of runway left, for a round that lasts 18–24 months; this is US-market guidance, not Indonesian data.
What is the difference between break-even and the turning point? Monthly break-even is the first month net cash flow turns non-negative. The turning point is the first month cumulative turns positive again: month 10 and month 19 here.
Does this simulation use Indonesian data? No. The rupiah figures are a dummy simulation; the duration benchmarks come from Y Combinator and Investopedia for the US market. Replace them with your own books.
Next step
Limit: Rama Digital is not a financial, legal, or tax adviser. This article explains the mechanism and the calculation, not a recommendation on the amount to raise; a licensed adviser must review every funding decision.
Before cash-flow numbers reach an investor meeting, the data behind them must be right. To check whether your buyer-source data from GA4GA4The Google analytics tool that records visits and actions on your site as events.What is Google Analytics 4 (GA4)?, PixelPixelA piece of code on a web page that tells the ad platform somebody opened the page or took an action.What is the Meta Pixel?, CAPICAPIA server path that sends conversion data from your system to the ad platform, without depending on the buyer browser.What is the Conversions API (CAPI)?, and UTMUTMA label you attach to a page address to mark the source of a visit, for example the campaign and the channel.Open the glossary reads correctly, use the Data Health Audit service. This check gives channel inflow projections correct data. The audit does not build a cash model, and it is not financial advice. To ask a question first, book a 30-minute session.
Sources
- SSRN: Financing J-Curves in Venture Capital (Hellmann, Montag, Tåg)
- Investopedia: Burn Rate
- Investopedia: Death Valley Curve
- Investopedia: Breakeven Point
- Investopedia: Payback Period
- Y Combinator: Advice for Companies with Less Than 1 Year of Runway
- Y Combinator: How Much Should You Spend After Fundraising?
- Y Combinator: A Guide to Seed Fundraising