Direct answer: The private equity J-curve is the pattern of fund returns that are negative in the early years, rising when the portfolio is sold. It has 3 causes. Management fees are charged on committed capital from inception. Legal and due diligence costs are paid first. Capital calls are drawn in stages before any distribution. Venture capital funds follow the same pattern. Read DPI, RVPI, TVPI, and IRR together with the fund's age, never alone.
Main condition: this applies to closed-end funds with committed capital, staged capital calls, and a fund life of about 10-12 years. Open-end funds, hedge funds, and direct investments without a fund structure follow other patterns. Limit: every duration and percentage in this article is US/global data (Investopedia, Carta, Hamilton Lane, ILPA, Cambridge Associates), not Indonesian fund data. The 10-year fund simulation uses dummy data. Rama Digital is not a financial, legal, or tax adviser. This article explains the mechanism and the calculation. A licensed legal and financial adviser must review every funding, valuation, and agreement decision. There is no promise of funding or results.
Sources were read on 14 September 2026; each page shows its own update date. Example numbers in this article are a dummy-data simulation.
30-second summary
- PE funds typically underperform in the investment period from management fees and expenses; the negative period spans 3-4 years (Hamilton Lane, undated; US/global data).
- Carta splits the J-curve into 3 stages on 20 October 2025: capital calls in years 1-3/4, investment in years 4-6, and harvesting in years 7-10+. The trough typically lasts 3-5 years.
- Carta: more than 60% of 2019-vintage VC funds had not distributed capital after 5 years. The median IRR of 2021-vintage funds was still negative after 3 years (US/global data).
- ILPA, June 2017: a subscription line delays capital calls and raises early IRR. A Cobalt study of 498 funds: up 206 bps by year 3, falling to 35-45 bps by fund end.
- Dummy simulation: US$100 million commitment; cumulative trough of -95 in year 5; cumulative turns positive in year 9; final DPI 1.70x; final IRR 9.8%.
The private equity J-curve: negative returns first, then a rise
The private equity J-curve is the pattern of a fund's value falling first, then rising past its starting point once the portfolio is sold. Read what the J-curve is for the general shape of the J-curve across 4 contexts.
Private equity funds have historically posted negative returns in their early years, then turned upward (Investopedia, updated 1 December 2025). Cambridge Associates writes: "the IRR is low or negative in the early years as the manager draws capital for investments and fees" (Cambridge Associates, 15 August 2017).
Investopedia states the private equity J-curve appears 5-8 years after the company purchase (Investopedia, updated 30 April 2026; US/global data).
Fund gains appear later through mergers, acquisitions, IPOs, and leveraged recapitalizations (Investopedia). In venture capital funds, investors exit 4-6 years after the initial investment (Investopedia, updated 19 March 2026; US/global data).
The problem: a year-3 report is read as the final result
In the early years, DPI sits at 0, so fund reporting leans on TVPI and IRR (Carta, 20 October 2025). Half of 2018-vintage funds had not returned capital to investors as of early 2025 (US/global data).
An LP sometimes sells a position on the secondaries market below the fund's recorded asset value (Cambridge Associates). A founder may misread investor pressure as fund failure; that is an inference, not a measured fact.
Wider context: global buyout distributions fell to 11% of net asset value in 2024, the lowest in more than 10 years (Investopedia citing Bain and Co., updated 10 September 2026; US/global data). The average buyout holding period lengthened to 5 years or more, from about 4.2 years in the early 2020s.
This fund stage sits inside a founder's longer funding journey. Read startup funding stages from pre-seed to Series C for the stages, from pre-seed to Series C.
3 causes of the fund J-curve: management fees, early costs, and staged capital calls
Management fees: charged on committed capital, not capital already at work
A management fee pays the investment manager for managing fund assets; it is usually a percentage of assets under management, or AUM (Investopedia, updated 18 July 2026).
Carta notes that this fee is often charged on total committed capital from inception, not on invested capital (Carta). A "2 and 20" structure charges 2% of assets yearly, plus a 20% performance fee above the hurdle (Investopedia, updated 9 September 2026). AngelList notes VC fees usually run 2-2.5% of committed capital yearly, stopping when the fund ends (AngelList, read 14 September 2026).
Early costs: legal, accounting, and due diligence leave first
Early fund costs include legal, accounting, administrative, and due diligence expenses, which leave before the portfolio produces returns (Carta). These, plus management fees, absorb cash first, before any distribution arrives (Investopedia).
Staged capital calls: capital is drawn as opportunities appear
Committed capital is what an investor promises a fund, drawn upfront or in stages (Investopedia, updated 20 January 2026).
Carta defines a capital call as a drawdown of committed capital when the manager finds a suitable opportunity (Carta). Carta splits the fund life into 3 stages: capital calls in years 1-3/4, investment in years 4-6, and harvesting in years 7-10+ (Carta, 20 October 2025; US/global data).
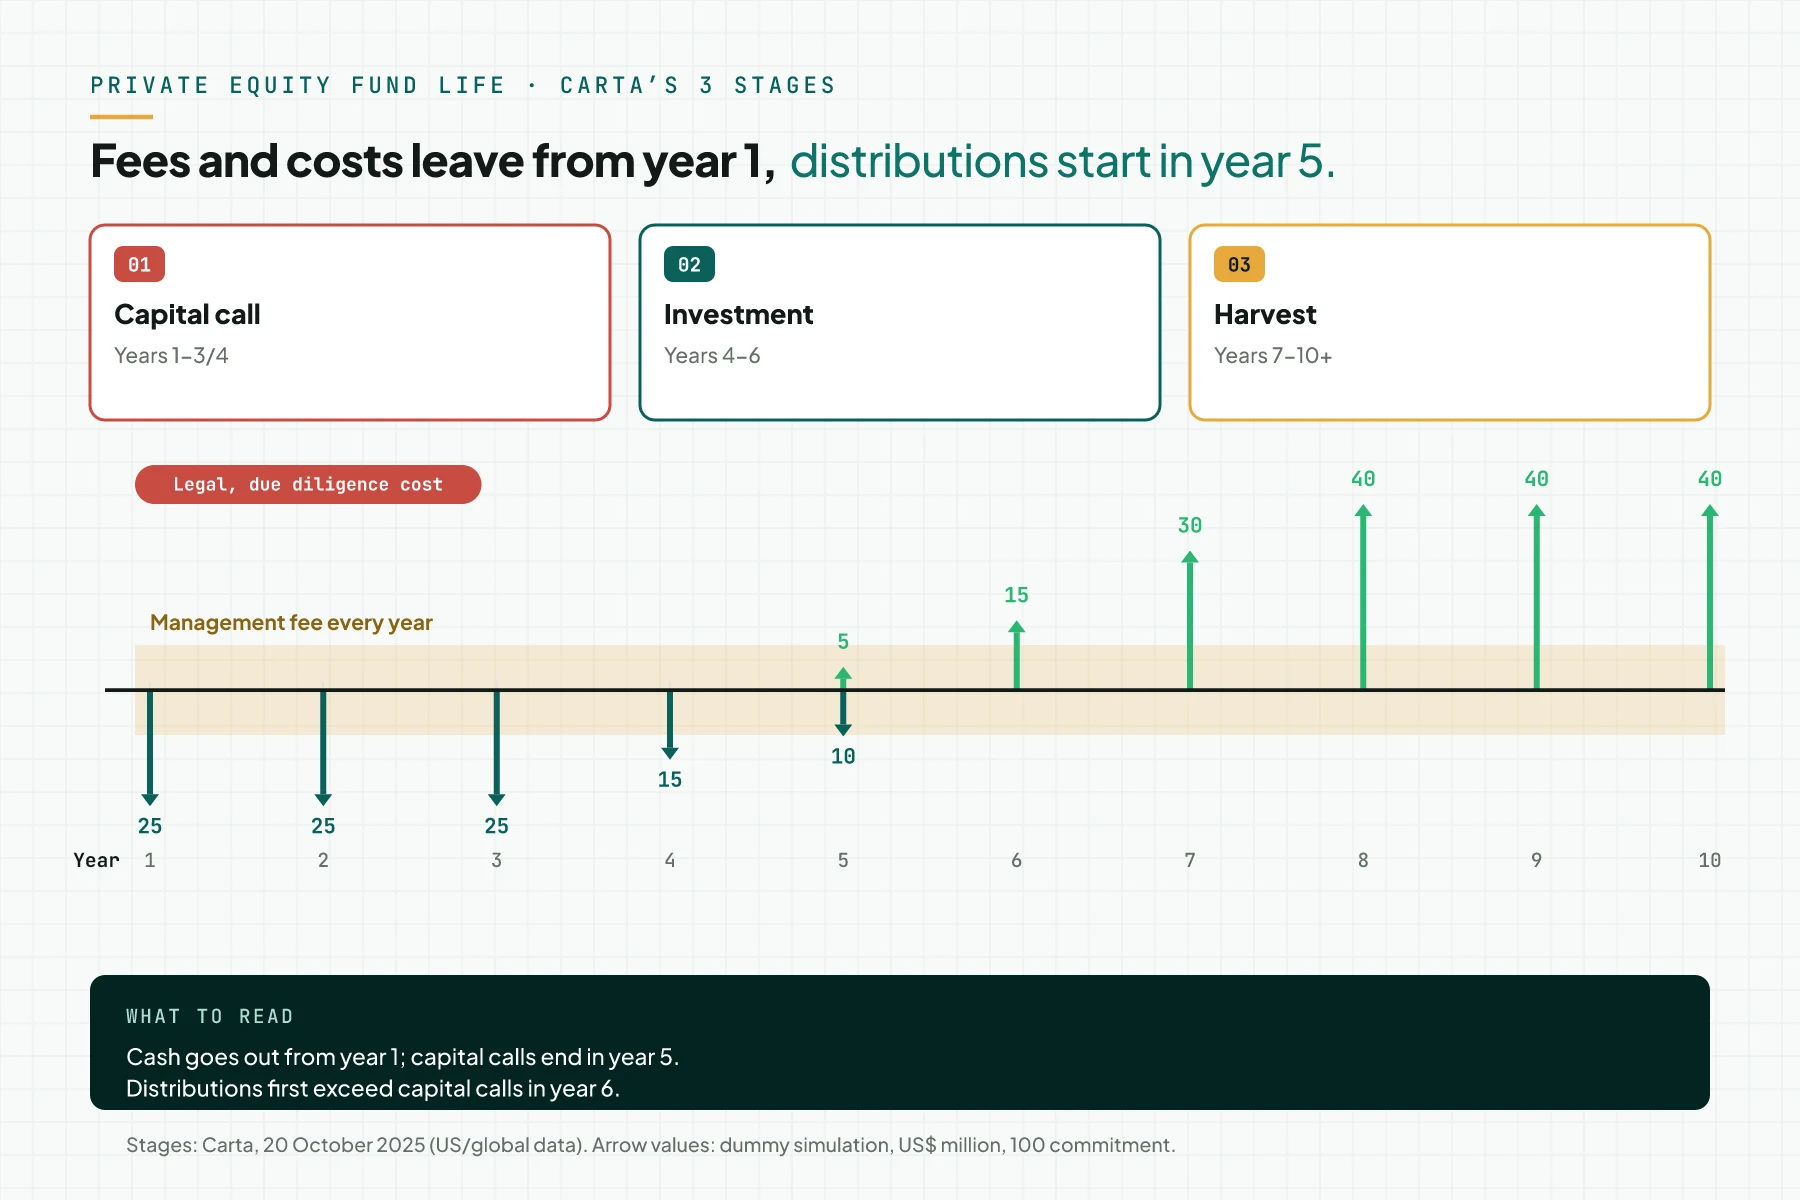
Traditional private equity funds ask for a capital commitment of roughly 10-12 years (Investopedia; US/global data). NVCA notes that a standard venture capital partnership agreement runs 10 years, with an extension option (NVCA).
4 metrics that move differently: DPI, RVPI, TVPI, IRR
A fund report uses 4 metrics: distributions to paid-in (DPI), residual value to paid-in (RVPI), total value to paid-in (TVPI), and internal rate of return (IRR). This article spells them out once, then uses the short forms.
DPI is cumulative distributions divided by paid-in capital, the total investors have paid into the fund excluding general partner contributions (Carta, 14 July 2024). It is also called the realization multiple; early values usually sit below 1.0x.
RVPI is residual value, or NAV, divided by paid-in capital, and it declines to 0 at fund end (Carta, 21 May 2024). TVPI is distributions plus residual value, divided by paid-in capital, equal to DPI plus RVPI. TVPI above 1.0x means the fund returned more than paid-in capital.
IRR is the discount rate that sets the net present value of all cash flows to 0; calculate it by iteration, or with Excel's =IRR() (Investopedia, updated 7 July 2026). IRR can have more than 1 value when the cash-flow sign changes more than once; XIRR handles irregular dates.
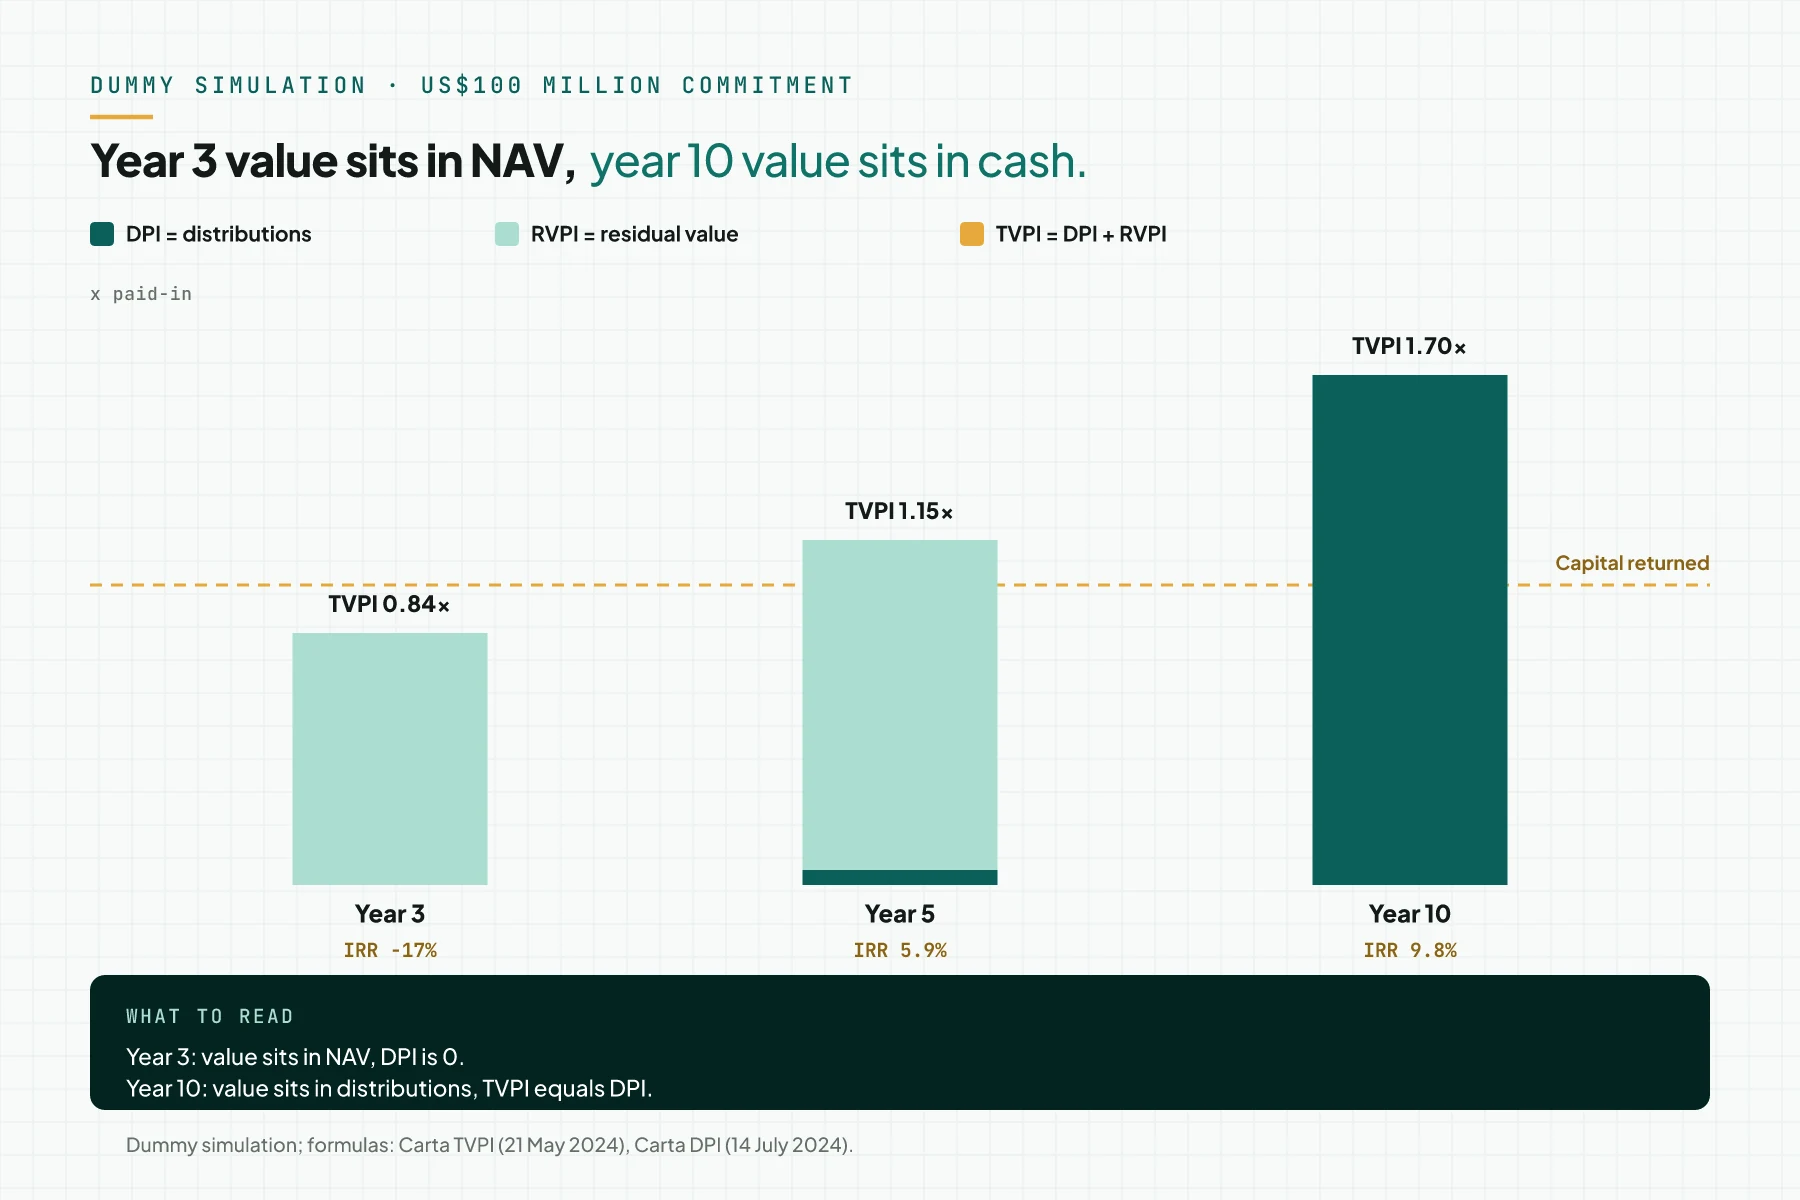
Table 1 compares them at years 3, 5, and 10 of the dummy simulation.
| Metric | Formula | Year 3 (paid-in 75) | Year 5 (paid-in 100) | Year 10 (paid-in 100) | What it shows | Source |
|---|---|---|---|---|---|---|
| DPI | cumulative distributions / paid-in capital | 0 / 75 = 0.00x | 5 / 100 = 0.05x | 170 / 100 = 1.70x | cash that has actually come back | Carta DPI |
| RVPI | residual value / paid-in capital | 63 / 75 = 0.84x | 110 / 100 = 1.10x | 0 / 100 = 0.00x | paper value not yet sold | Carta TVPI |
| TVPI | (distributions + residual value) / paid-in capital | 0.84x | 1.15x | 1.70x | total value, net of fees and carry | Carta TVPI |
| IRR | discount rate that sets NPV of cash flows to 0 | -17% | 5.9% | 9.8% | annual rate; sensitive to capital call and distribution timing | Investopedia IRR |
A 10-year fund simulation: US$100 million commitment (dummy data)
The simulation below uses dummy data, built on 14 September 2026. This fund commits US$100 million, with year 1 as 2027 and year 10 as 2036; cash flow is calculated at year end.
Assumptions run in US$ million. Capital calls are 25, 25, 25, 15, and 10 in years 1-5. Distributions are 5, 15, 30, 40, 40, and 40 in years 5-10. NAV is 63 in year 3 and 110 in year 5.
| Year | Capital call (US$ million) | Distribution (US$ million) | LP net cash flow (US$ million) | Cumulative (US$ million) |
|---|---|---|---|---|
| 1 | 25 | 0 | -25 | -25 |
| 2 | 25 | 0 | -25 | -50 |
| 3 | 25 | 0 | -25 | -75 |
| 4 | 15 | 0 | -15 | -90 |
| 5 | 10 | 5 | -5 | -95 |
| 6 | 0 | 15 | 15 | -80 |
| 7 | 0 | 30 | 30 | -50 |
| 8 | 0 | 40 | 40 | -10 |
| 9 | 0 | 40 | 40 | 30 |
| 10 | 0 | 40 | 40 | 70 |
Result: final paid-in capital 100, final distributions 170, final DPI 1.70x, final IRR 9.8%. The cumulative trough of -95 falls in year 5; the cumulative turns positive in year 9.
Points in between: in year 3, NAV of 63 gives TVPI 0.84x and IRR -17%. In year 5, NAV of 110 gives DPI 0.05x, RVPI 1.10x, TVPI 1.15x, and IRR 5.9%.
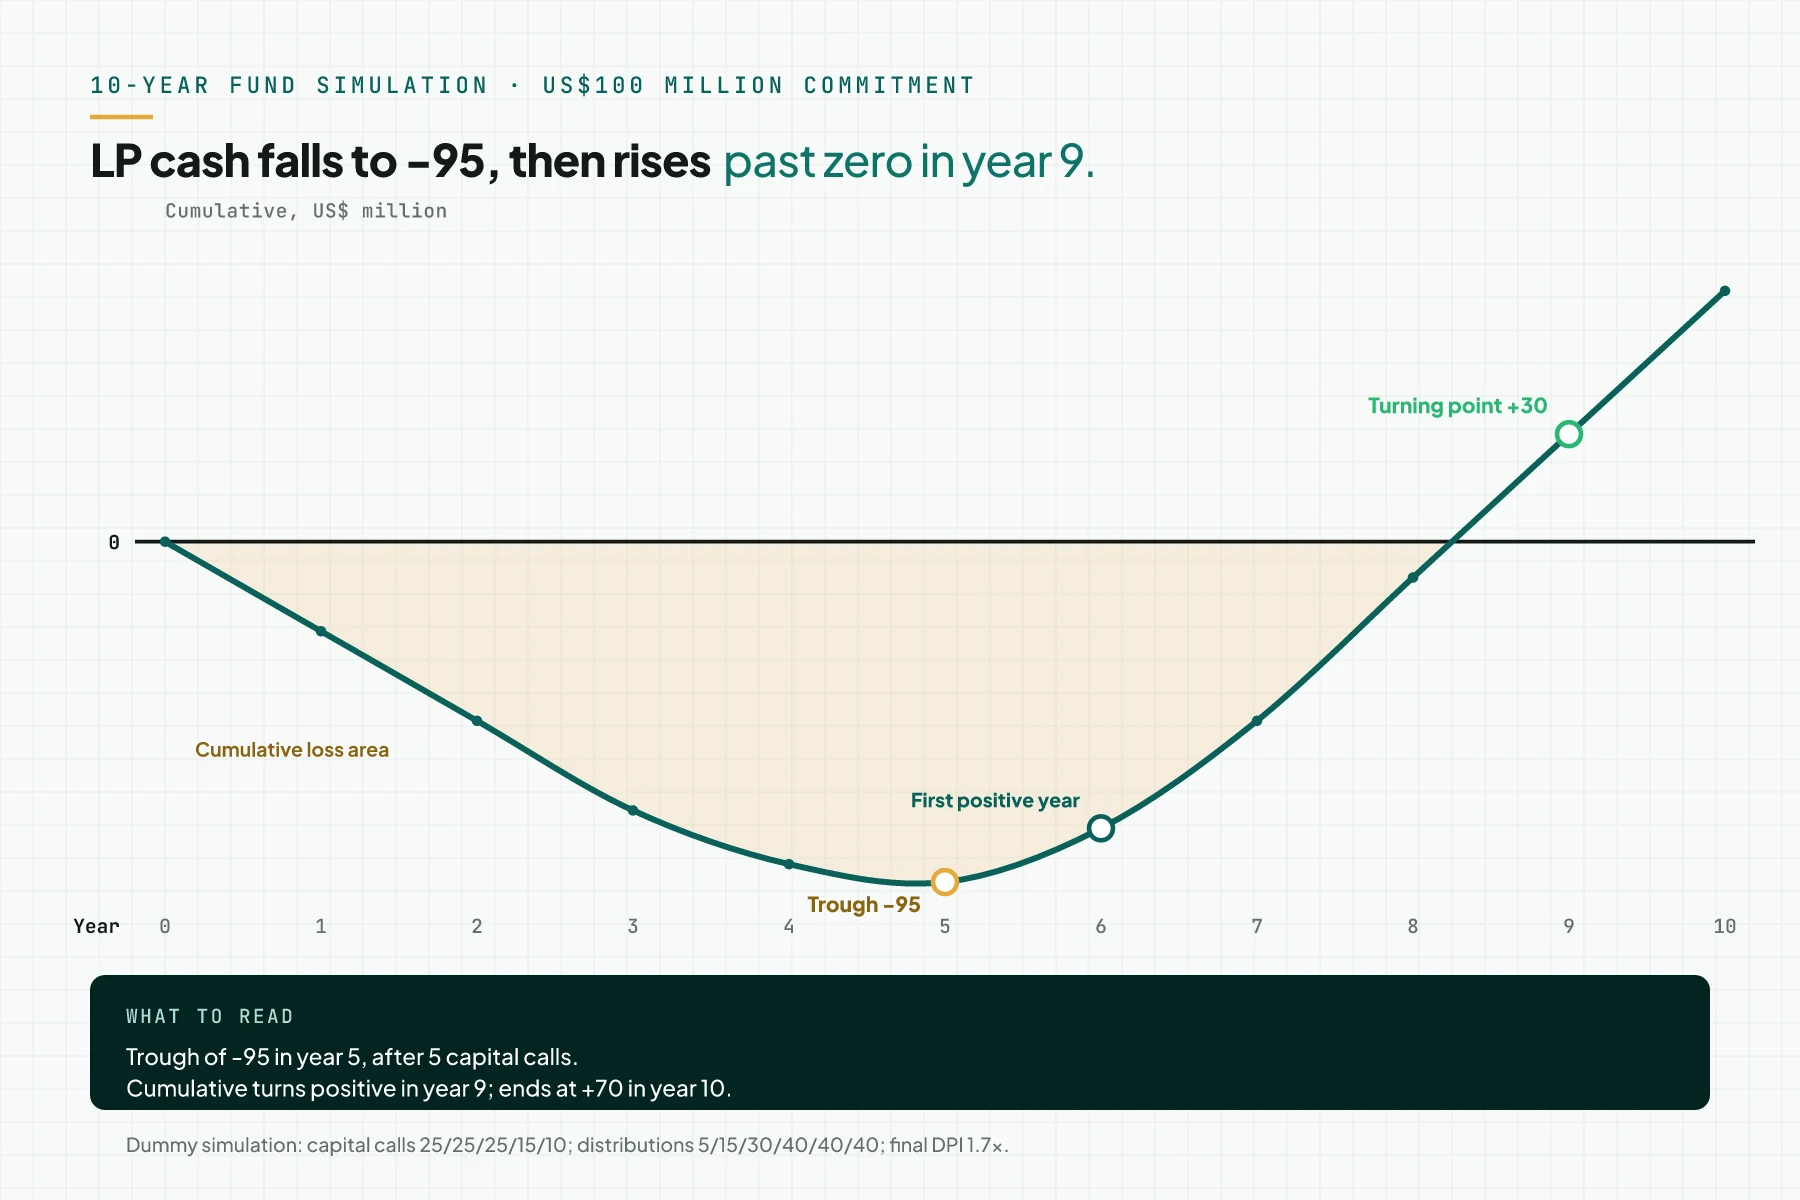
The key reading: in year 3, the report shows a 16% loss on paid-in capital and DPI at 0. Yet the same fund ends at DPI 1.70x.
How to shorten the fund J-curve, and what it costs
Carta lists 4 ways to soften a fund's J-curve: secondaries, co-investments, a capital call line of credit or subscription line, and portfolio construction (Carta).
- Secondaries: buying an existing LP position, often at a discount to NAV, so distributions arrive earlier (Cambridge Associates). Costs: secondary funds need 7 years to reach DPI 1.0x, with 40% distributed in the first 5 years; funds-of-funds take 11+ years (data as of 30 June 2016; US/global data).
- Co-investment: an LP invests directly alongside the fund in 1 deal. Part of the capital works sooner than waiting for the full capital call.
- Subscription line: a credit facility that delays capital calls, shortens the J-curve, and raises early-life IRR (ILPA, June 2017). The cost: ILPA's example thresholds cap uncalled capital at 15-25% and 180 days outstanding, with net IRR required with and without this facility (ILPA).
- Portfolio construction: sequencing investments from the start, so the first distribution does not wait on the whole portfolio.
The IRR gain is temporary: 206 bps by year 3, down to 35-45 bps by fund end, per a 498-fund Cobalt study (ILPA; US/global data). This article recommends no product.
What it means for a founder raising from a VC
Your startup's J-curve sits inside your investor's fund J-curve. Read the startup cash-flow J-curve: trough and turning point to calculate it. Read what the J-curve is for the general 3-point framework.
NVCA notes a VC investor works with a founder for 3-8 years, with payoff at acquisition or an IPO (NVCA, read 14 September 2026). Investopedia cites research showing about half of VC-backed startups fail to return investor capital (Investopedia; US/global data).
NVCA notes a VC fund reserves 3-4 times the first investment for follow-on rounds (NVCA). Fund age and that reserve influence when an investor pushes for an exit; this is an inference, not a written rule.
Investors read market size, or SOM, and acquisition capacity to judge whether a portfolio's J-curve can turn. Read ICP, wedge market, SOM, and how investors read them (Indonesian source). The right ad budget affects cash inflow timing; read from TAM, SAM, SOM to a Meta Ads budget.
Without giving decision advice, ask a prospective investor these 3 questions:
- What is the vintage, or the year this fund was formed?
- How much of the fund's life remains until maturity?
- What is the fund's policy on follow-on funding?
Checklist for reading a fund report or assessing an investor
- Record the vintage and the remaining fund life before you read any number (owner: report reader; evidence: 2 numbers on page 1).
- Read DPI, RVPI, TVPI, and IRR in 1 row with the fund's year n (owner: report reader; evidence: 1 table row per period).
- Check whether IRR is reported with and without the subscription line (owner: LP or adviser; evidence: 2 IRR figures in the report).
- Recalculate TVPI as DPI plus RVPI from the reported numbers (owner: finance; evidence: a 0 difference after rounding).
- Label every benchmark with its region: Carta, Hamilton Lane, and ILPA are US/global data (owner: author; evidence: a region column).
- Founder: ask each prospective investor for the vintage, remaining fund life, and follow-on policy (owner: founder; evidence: dated meeting notes).
- Take the report or term sheet to a licensed financial and legal adviser before any decision (owner: LP or founder; evidence: review notes).
- Stop criterion: stop and request the data again when TVPI does not equal DPI plus RVPI, or the report omits paid-in capital. Without those 2 items, no other number can be interpreted.
Private equity and venture capital J-curve FAQ
What is the private equity J-curve? Fund returns are negative in the early years from fees and costs, then rise when the portfolio is sold; the negative period spans 3-4 years (US/global data).
Do venture capital funds follow a J-curve too? Yes. VC funds show the same pattern: median IRR was still negative 3 years after 2021-vintage funds formed (US/global data).
Why do management fees make returns negative? A management fee, often 2% of committed capital yearly from inception, is charged before any distribution arrives, so cash out leads cash in early.
What is the difference between DPI, TVPI, and IRR? DPI is distributions divided by paid-in capital. TVPI is distributions plus residual value, divided by paid-in capital. IRR is the discount rate that sets the NPV of cash flows to 0.
Can the fund J-curve be shortened? Yes, through secondaries, co-investment, a subscription line, or portfolio construction. A subscription line's early IRR gain shrinks to 35-45 basis points by fund end.
What does the fund J-curve mean for a founder? Your startup's J-curve sits inside your investor's fund J-curve. A VC usually works with a founder for 3-8 years. Ask a prospective investor for the vintage and remaining fund life.
Next step
Rama Digital is not a financial, legal, or tax adviser, and this article is not investment advice; a licensed adviser must review every funding decision. If your team wants to map its operational bottlenecks and a first step before you talk to investors, use the AI Diagnostic service. To ask a question first, book a 30-minute session.
Sources
- Investopedia: J Curve
- Investopedia: J Curve effect
- Hamilton Lane: J-Curves, An Introduction
- Cambridge Associates: When Secondaries Should Come First
- Investopedia: Venture Capital
- Carta: J-curve
- Investopedia: Private Equity
- Investopedia: Management Fee
- Investopedia: Two and Twenty
- Investopedia: Committed Capital
- AngelList: Venture Capital Fee Economics
- NVCA: What is Venture Capital?
- Carta: DPI
- Carta: TVPI
- Investopedia: Internal Rate of Return (IRR)
- ILPA: Subscription Lines of Credit and Alignment of Interests (PDF)
- ILPA: Subscription Lines of Credit