Direct answer: A J-curve is a pattern in which a number falls below its starting point first, then rises past that starting point. The shape follows the letter J. It appears in startup cumulative cash flow, private equity and venture capital fund returns, and productivity after digital transformation. The same pattern appears in the trade balance after a currency depreciation. The decision depends on 3 numbers, not on the shape: trough depth, time to the turning point, and the trigger of the rise.
Main condition: the pattern is a J-curve only when 1 clear action causes the initial fall. That action can be an investment, a capital call, a new system, or a currency devaluation. The final number must pass the starting point. A decline with no planned trigger for the rise is not a J-curve. Limit: the durations and market numbers here are US/global data from open sources, not Indonesian data. The worked example uses a dummy-data simulation. Rama Digital is not a financial, legal, or tax adviser. A licensed legal and financial adviser must review every funding, valuation, and agreement decision. There is no promise of funding or results.
We read these sources on 14 September 2026; each page shows its own update date. Example numbers here are a dummy-data simulation, not real customer or investor data.
30-second summary:
- Definition: a J-curve falls first, then recovers past its starting point (Investopedia: J Curve effect).
- Private equity funds: a 3-4 year negative return period (Hamilton Lane: J-Curves, An Introduction) and a 3-5 year trough (Carta: J-curve); US/global data.
- Productivity: adjusted US TFP was 11.3% above the official measure at end-2004 and 15.9% above at end-2017, US data (NBER Working Paper 25148: The Productivity J-Curve; AEJ Macroeconomics 13(1): The Productivity J-Curve).
- Trade balance: Japan posted a record 1.3 trillion yen deficit in 2013 after the yen weakened (Investopedia: J Curve (jcurve.asp)). A 2005 Bank Indonesia study found an Indonesian J-curve only against Japan, South Korea, and Germany (BEMP (Bank Indonesia): Husman 2005).
- Dummy simulation: a trough of -Rp900 million in months 9-10, monthly break-even in month 10, cumulative turning point in month 19.
The J-curve: it falls first, then rises past the starting point
Investopedia: J Curve effect defines the J-curve as an initial decline, then a large recovery that passes the starting point. The J-curve trend line ends above its starting point. Investopedia sums up the pattern as a state that gets worse before it gets better: "sometimes things get worse before they get better".
The shape needs 1 condition: an initial opposite response to 1 clear action, then a strong expected response (Investopedia: J Curve (jcurve.asp)). Without a trigger action, the chart is only a decline, not a J-curve. J-curves appear in economics, private funds, medicine, and political science; this article covers 4 business contexts only.
Currency appreciation produces the opposite pattern, called a reverse J-curve; we do not cover it further here. Corporate Finance Institute: J Curve gives a similar secondary definition: a line that falls first, then rises above its starting point. A J-curve differs from a hockey stick: a hockey stick stays flat first, then rises without ever falling below its starting point. Read the full comparison in J-curve vs hockey stick vs death valley curve.
The problem: an unmeasured J-curve looks like failure
A J-curve trough looks like failure when you have not measured it first. The wrong decision appears right at this point: stopping an investment, cutting the team, or reverting to an old system before the turning point arrives.
Private funds show the same pattern. DPI is 0 in the early years, so reporting looks empty (Carta: J-curve). The median IRR of 2021-vintage venture capital funds was still negative 3 years after inception, US/global data (Carta: J-curve).
Productivity shows the same pattern: measured productivity is underestimated in a new technology's early years (AEJ Macroeconomics 13(1): The Productivity J-Curve). Group performance can also drop during major organizational change, per the Satir Change Model, a secondary source (Steven M. Smith: The Satir Change Model (secondary source)).
For startups, a longer death valley curve raises the odds of an early failure (Investopedia: Death Valley Curve). Y Combinator calls less than 2 months of cash the point of no return (Y Combinator: Advice for companies with less than 1 year of runway). Correct monthly numbers come from your books; read accounting software as the source of finance numbers (Indonesian source) for this source.
Anatomy of a J-curve: 3 points and 2 numbers to record
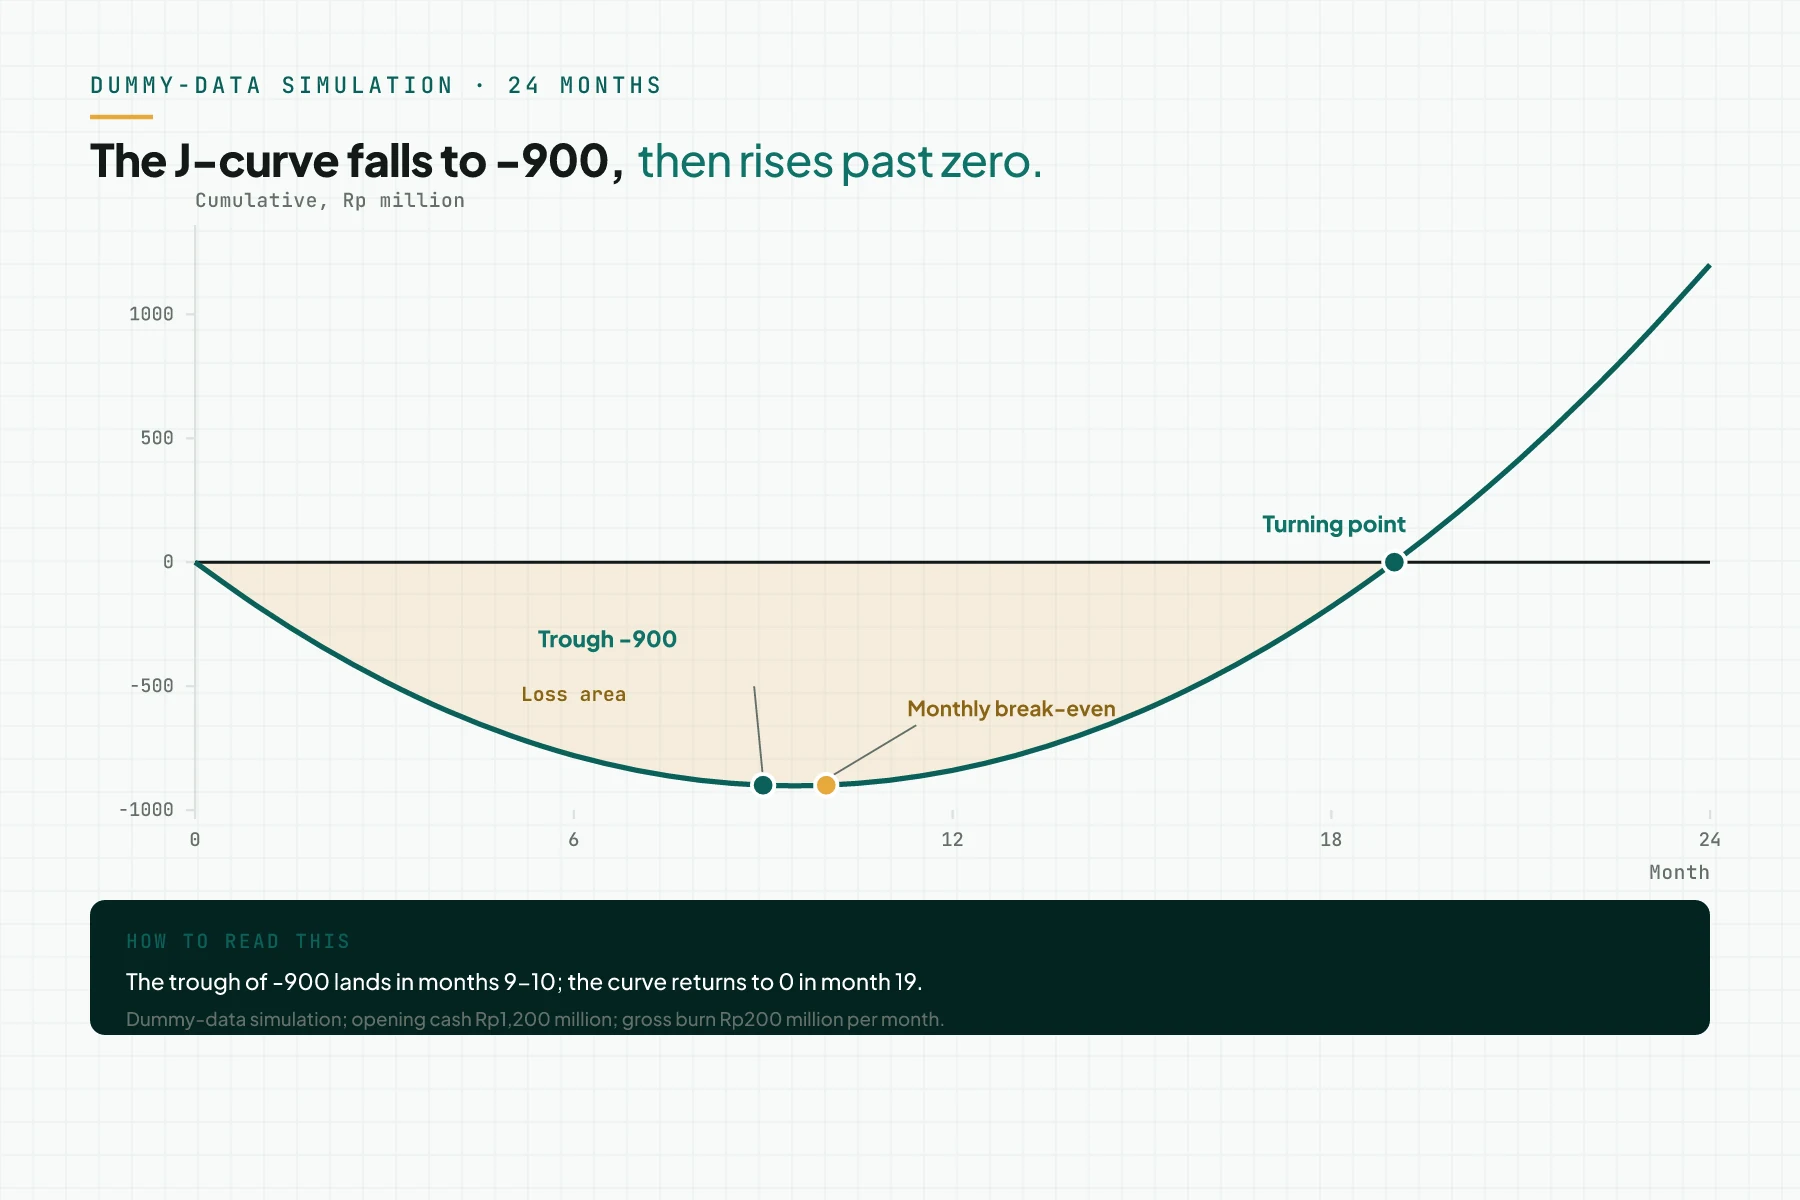
A J-curve has 3 points and 2 numbers you must record before you judge its shape. Figure 1 marks all 3 on a 24-month simulation.
Trough
The trough is the minimum value of your cumulative cash flow. Peak funding need equals its absolute value: Trough = min(Kum_n).
Break-even point
The break-even point is the first month net cash flow is equal to or above 0: CF_n >= 0. The curve stops falling here, but its value is still below zero. Investopedia: Breakeven Point defines the break-even point as the sales level where revenue equals total costs.
Turning point
The turning point is the first month cumulative cash flow returns to equal or above 0: Kum_n >= 0. Payback period is the time; break-even is the value (Investopedia: Payback Period).
Cumulative cash flow formula: Kum_n = CF_1 + ... + CF_n. Net burn formula: NB = GB - (R - HPP); GB is gross burn, and HPP feeds the gross margin calculation (Investopedia: Burn Rate). Both decision numbers, depth and duration, come from 1 chart.
4 J-curve contexts: startups, private funds, digital transformation, trade balance
4 contexts use the same J-curve shape, with different axes and triggers. Figure 2 places all 4 side by side.
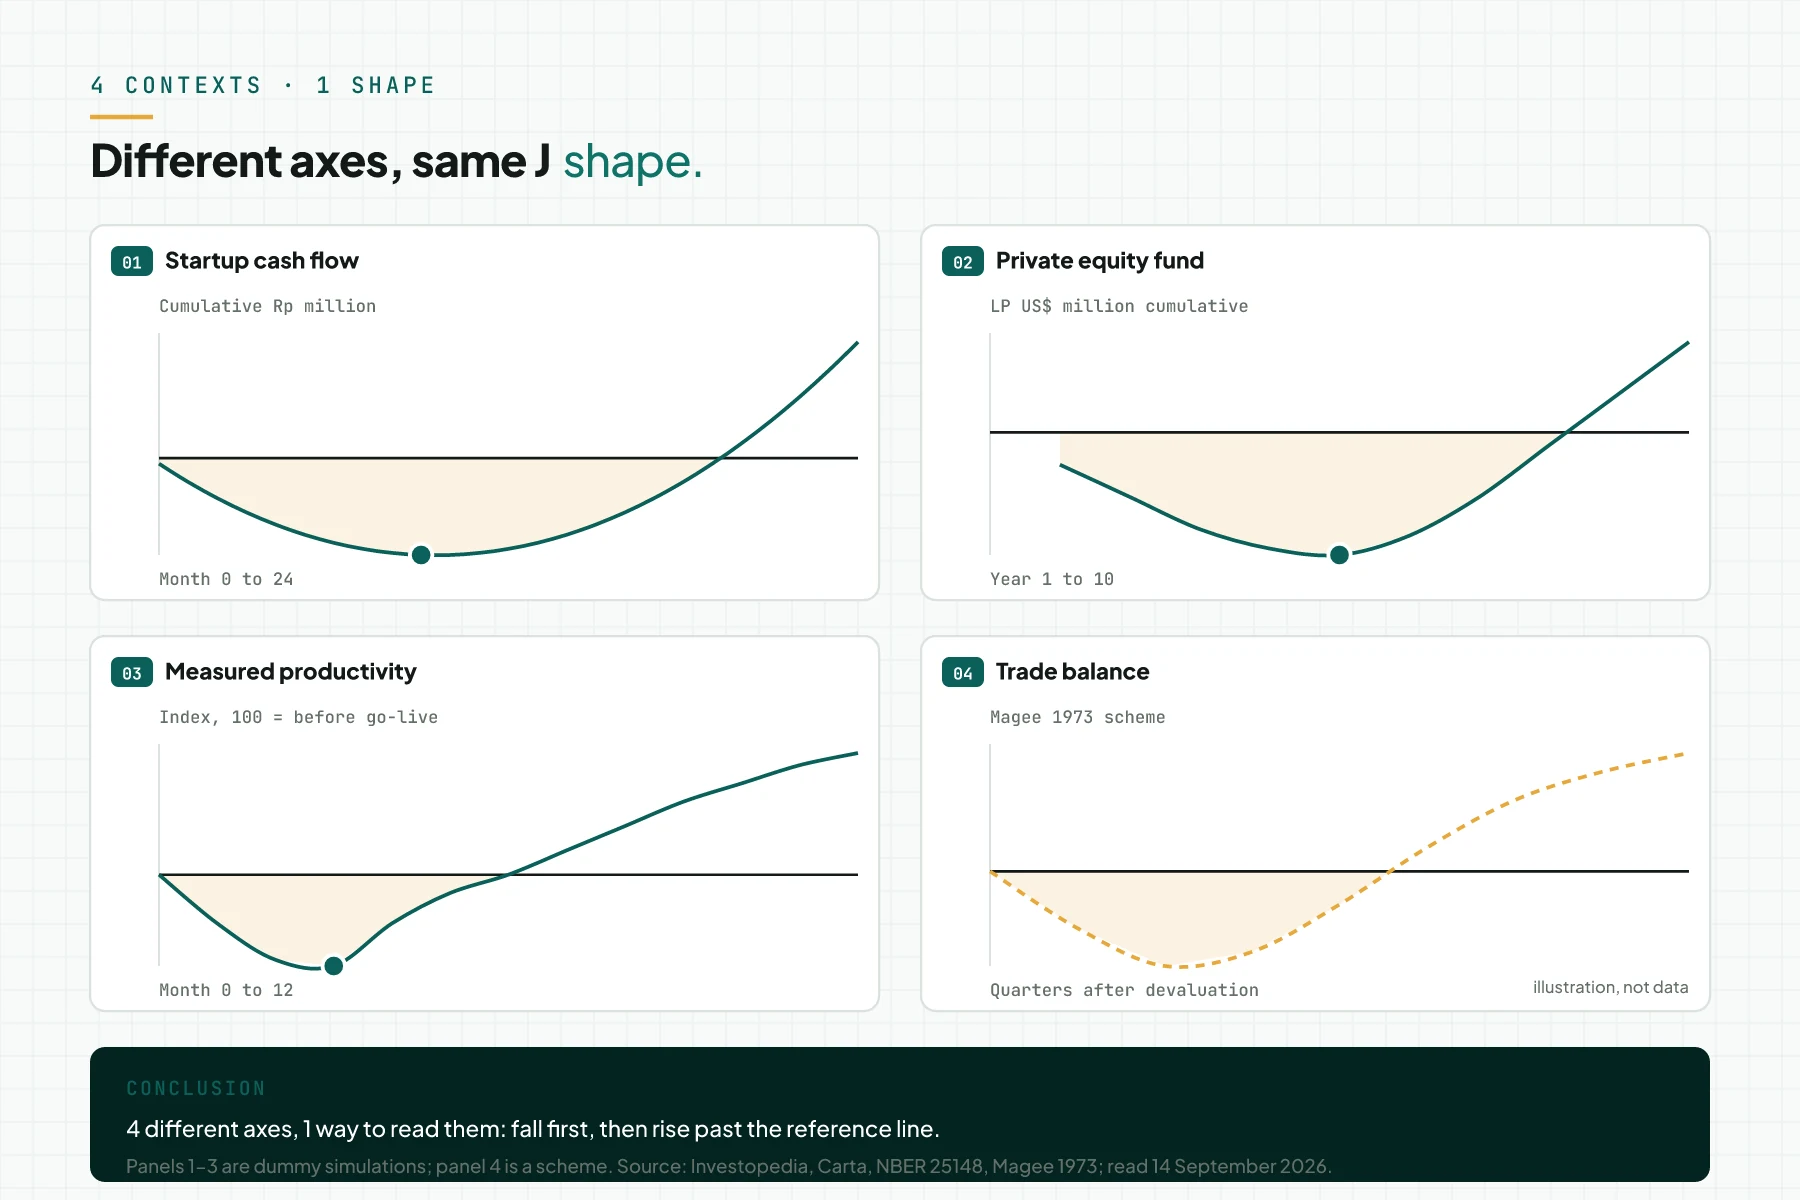
Startup cash flow
Startup cash flows are said to follow a J-curve: "Their cash flows are said to follow a so-called J-curve" (SSRN: Financing J-Curves in Venture Capital (Hellmann, Montag, Tåg)). Its shape depends on investors' capacity to fund a long stretch of negative cash flow. Y Combinator advises raising enough to reach the next milestone, 12-18 months later (Y Combinator: A guide to seed fundraising); an average funding round lasts 18-24 months (Y Combinator: How Much Should You Spend After Fundraising?). Read the full calculation in the startup cash-flow J-curve: trough and turning point.
Private equity and venture capital funds
Fund returns turn negative because management fees and early costs absorb cash before any distribution (Investopedia: J Curve (jcurve.asp)). The negative period spans 3-4 years (Hamilton Lane: J-Curves, An Introduction), and the trough spans 3-5 years (Carta: J-curve); both are US/global data. Carta splits the fund J-curve into 3 stages. Stage 1 is capital call, years 1 to 3 or 4. Stage 2 is investment, years 4 to 6. Stage 3 is harvesting, years 7 to 10 or later. Read the deep dive in the private equity and venture capital J-curve.
Digital transformation
A general purpose technology such as AI requires intangible complementary investment: new processes, products, business models, and people (NBER Working Paper 25148: The Productivity J-Curve). The Brynjolfsson, Rock, and Syverson model yields a productivity J-curve: "Our model generates a Productivity J-Curve". Intangible-adjusted US TFP was 11.3% above the official measure at end-2004 and 15.9% above at end-2017, US data (AEJ Macroeconomics 13(1): The Productivity J-Curve). Read the deep dive in the digital transformation J-curve.
Trade balance
After a currency weakens, the trade deficit worsens first. Import prices rise faster than import volume falls (Investopedia: J Curve (jcurve.asp)). Magee 1973 splits the post-devaluation response into 3 periods (Brookings: Magee 1973, Currency Contracts, Pass-Through, and Devaluation). Japan posted a record 1.3 trillion yen deficit in 2013 after the yen weakened. A 2005 Bank Indonesia study found an Indonesian J-curve only against Japan, South Korea, and Germany. A 1% rupiah depreciation raised the export-import ratio by 0.37% (BEMP (Bank Indonesia): Husman 2005).
| Context | X axis x Y axis | Cause of the fall | Trigger of the rise | Typical duration (source, region) | Deep-dive article |
|---|---|---|---|---|---|
| Startup cash flow | month x cumulative cash flow | gross burn exceeds cash inflow | net cash inflow passes gross burn | 1 round lasts 18-24 months; raise for 12-18 months (YC, US/global data) | the startup cash-flow J-curve: trough and turning point |
| Private equity and VC funds | year x LP cumulative cash flow | management fees and early costs before any distribution | exit through M&A or an IPO | negative 3-4 years (Hamilton Lane); trough 3-5 years (Carta); US/global data | the private equity and venture capital J-curve |
| Digital transformation | month x measured productivity index | intangible complementary investment goes unrecorded | new processes, skills, and business models finish installing | US TFP 11.3% above the official measure (end-2004) and 15.9% (end-2017); NBER 25148; US data | the digital transformation J-curve |
| Trade balance | quarter x trade balance | import prices rise faster than import volume falls | export volume rises, consumers switch to local goods | Magee 1973 3-period scheme (US data); Indonesia only vs Japan, South Korea, Germany (BI 2005) | none; 1 paragraph in this article |
3 questions to read a J-curve before you add capital
3 questions give 3 numbers, then 1 decision. Figure 3 shows the flow.
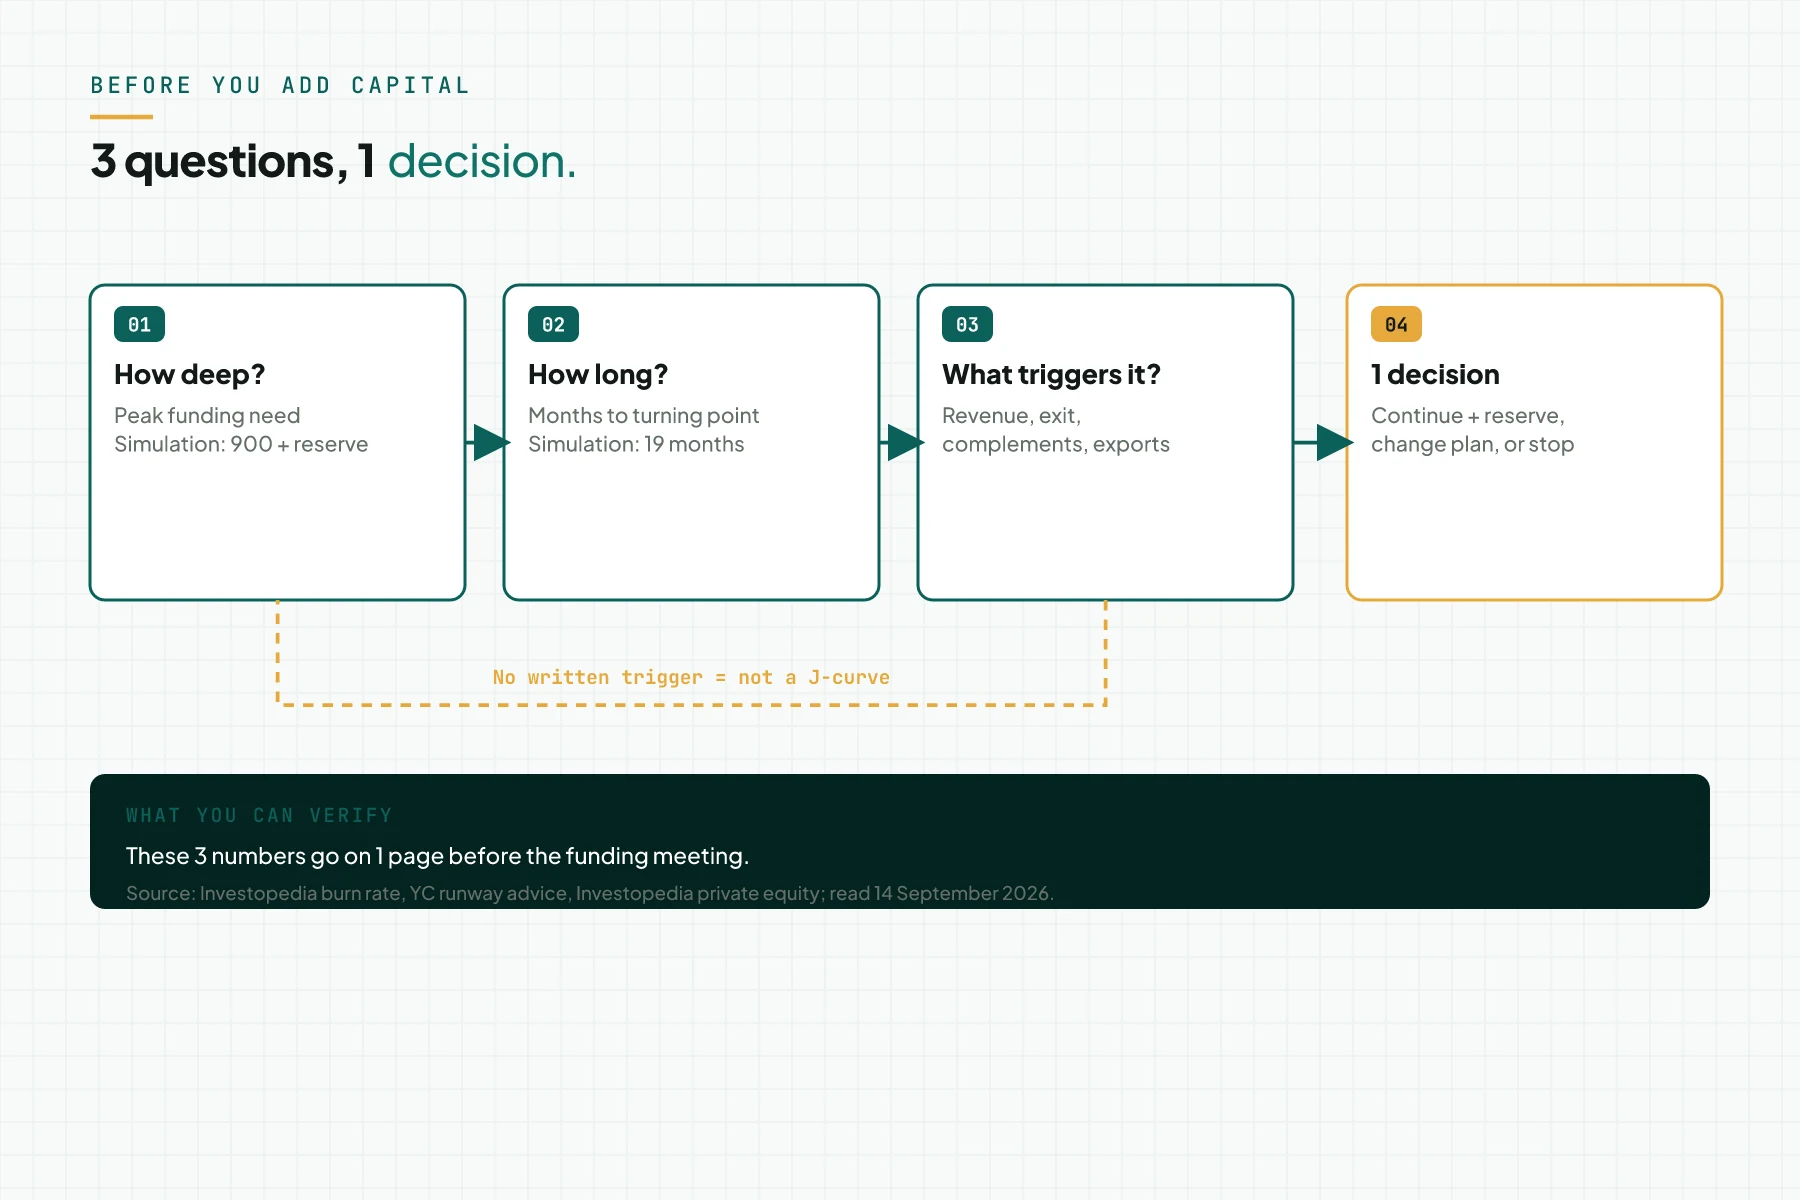
How deep
Peak funding need equals the trough's absolute value, plus a reserve. Investopedia: Burn Rate cites a general recommendation: hold cash for 3-6 months of expenses, US/global data. Our simulation: 900 plus a reserve.
How long
Compare the months to the turning point with your funding horizon. Y Combinator advises starting to raise with about 8 months of runway left; this is YC advice, not a market number (Y Combinator: How Much Should You Spend After Fundraising?). Traditional private equity commitments run about 10-12 years, US/global data (Investopedia: Private Equity Explained). Read what Series A funding is for the round that usually follows a startup J-curve.
What triggers the rise
The trigger is revenue passing costs, an exit through M&A or an IPO within 4-6 years (Investopedia: What Is Venture Capital?), a completed complementary investment, or rising export volume. Without a written trigger, do not call the pattern a J-curve. The shape of cash inflow depends on the revenue model; read revenue model vs business model.
Rama Digital recommendation: write these 3 numbers on 1 page before the funding meeting. Condition: the monthly numbers come from your books, not from a projection alone.
Worked example: 1 startup J-curve over 24 months
This dummy simulation uses opening cash of Rp1,200 million and a flat gross burn of Rp200 million per month. Net cash inflow in month n = 20 × n million. Month 1 starts October 2026; the simulation was built 14 September 2026 (Investopedia: Burn Rate).
| Month | Net cash inflow (Rp million) | Gross burn (Rp million) | Net cash flow (Rp million) | Cumulative (Rp million) | Cash balance (Rp million) |
|---|---|---|---|---|---|
| 1 | 20 | 200 | -180 | -180 | 1,020 |
| 3 | 60 | 200 | -140 | -480 | 720 |
| 6 | 120 | 200 | -80 | -780 | 420 |
| 9 | 180 | 200 | -20 | -900 | 300 |
| 10 | 200 | 200 | 0 | -900 | 300 |
| 12 | 240 | 200 | 40 | -840 | 360 |
| 15 | 300 | 200 | 100 | -600 | 600 |
| 19 | 380 | 200 | 180 | 0 | 1,200 |
| 20 | 400 | 200 | 200 | 200 | 1,400 |
| 24 | 480 | 200 | 280 | 1,200 | 2,400 |
Reading: the trough of -900 lands in months 9-10, with a cash balance of Rp300 million. Monthly break-even lands in month 10. The cumulative turning point lands in month 19. Month 1 runway = 1,200 divided by 180 = 6.7 months. The full calculation and a sensitivity test live in the startup cash-flow J-curve: trough and turning point; this article only shows the shape.
6 common mistakes when reading a J-curve
- Calling every decline a J-curve with no trigger action and no plan for a rise (Investopedia: J Curve (jcurve.asp)).
- Reading US/global durations as if they were Indonesian data. Open sources carry no Indonesian median for a J-curve.
- Swapping a J-curve for a hockey stick. A hockey stick never falls below its starting point (Investopedia: Hockey Stick Chart); read J-curve vs hockey stick vs death valley curve.
- Panicking over 0 DPI and a negative IRR in a fund's early years. Private equity IRR is usually low or negative in the early years (Cambridge Associates: When Secondaries Should Come First). IRR can also carry more than 1 value when cash-flow signs change more than once (Investopedia: Internal Rate of Return (IRR)).
- Equating the Kübler-Ross Change Curve with a financial J-curve. That name is a registered trademark, and the model covers human response to change (EKR Foundation: Kübler-Ross Change Curve).
- Calculating runway from today's cash, not from the trough. Less than 2 months of cash is the point of no return, per Y Combinator (Y Combinator: Advice for companies with less than 1 year of runway).
Checklist before you accept a J-curve in a plan
Use these 8 items before you sign off on a plan that carries a J-curve.
- Write the 1 trigger action for the fall (investment, capital call, new system) with a start date (owner: founder; evidence: 1 dated sentence in the plan).
- Collect monthly net cash inflow and gross burn from the books, at least 3 months (owner: finance; evidence: accounting software export).
- Calculate cumulative cash flow and mark the trough, monthly break-even, and turning point (owner: finance; evidence: 1 dated chart).
- Write the peak funding need as the trough plus a reserve of 3-6 months of costs (owner: founder; evidence: a rupiah figure on 1 page).
- Write a verifiable trigger for the rise: revenue, exit, or a completed complementary investment (owner: founder; evidence: 1 monthly indicator).
- Label every benchmark number with its region: US/global or Indonesia (owner: plan author; evidence: source and region column).
- Take these 3 numbers, depth, duration, and trigger, to a licensed financial adviser before the funding meeting (owner: founder; evidence: review notes).
- Stop criterion: stop the plan when cash falls below 2 months of costs without confirmed new inflow. Stop it also when the turning point slips more than 6 months from the plan. Return to item 1.
J-curve FAQ
What is a J-curve in business? A J-curve is a pattern in which a number falls below its starting point, then rises past it. In business, it appears in cumulative cash flow after a new investment. You read 2 decision numbers: trough depth and time to the turning point.
How is a J-curve different from a hockey stick? A J-curve falls below its starting point first, then rises past it. A hockey stick stays flat first, then rises without ever falling below its starting point (Investopedia: Hockey Stick Chart). Read the full comparison in J-curve vs hockey stick vs death valley curve.
How long does a J-curve last? There is no single number. Private equity funds post a 3-4 year negative return period (Hamilton Lane: J-Curves, An Introduction) and a 3-5 year trough (Carta: J-curve); both are US/global data. A startup J-curve depends on your own burn rate and cash inflow.
Does a J-curve always end above its starting point? By definition, yes, but in practice it is not guaranteed. About half of VC-backed startups fail to return investor capital, US/global data (Investopedia: What Is Venture Capital?). Without a trigger for the rise, a decline never reverses.
What is the J-curve effect on the trade balance? After a currency weakens, the trade deficit worsens first, then improves (Investopedia: J Curve (jcurve.asp)). Japan showed this pattern in 2013. A 2005 Bank Indonesia study found the effect against only 3 trading partners (BEMP (Bank Indonesia): Husman 2005).
What is the productivity J-curve? The Brynjolfsson, Rock, and Syverson model explains this pattern (NBER Working Paper 25148: The Productivity J-Curve). Measured productivity falls first while a company builds intangible complementary investment, then rises (AEJ Macroeconomics 13(1): The Productivity J-Curve). Read the deep dive in the digital transformation J-curve.
Next step
Rama Digital is not a financial, legal, or tax adviser. Every funding, valuation, and agreement decision stays with you and a licensed adviser. If you want to map your bottleneck and first step before a funding meeting, use the AI Diagnostic service. 1 session gives a problem map and a written first step; it does not calculate your J-curve and gives no financial advice. To ask a question first, book a 30-minute session.
Sources
- Investopedia: J Curve effect
- Investopedia: J Curve (jcurve.asp)
- Corporate Finance Institute: J Curve
- Carta: J-curve
- NBER Working Paper 25148: The Productivity J-Curve
- AEJ Macroeconomics 13(1): The Productivity J-Curve
- Investopedia: Death Valley Curve
- Y Combinator: Advice for companies with less than 1 year of runway
- Steven M. Smith: The Satir Change Model (secondary source)
- Investopedia: Breakeven Point
- Investopedia: Payback Period
- Investopedia: Burn Rate
- SSRN: Financing J-Curves in Venture Capital (Hellmann, Montag, Tåg)
- Y Combinator: How Much Should You Spend After Fundraising?
- Y Combinator: A guide to seed fundraising
- Hamilton Lane: J-Curves, An Introduction
- Brookings: Magee 1973, Currency Contracts, Pass-Through, and Devaluation
- BEMP (Bank Indonesia): Husman 2005
- Investopedia: Private Equity Explained
- Investopedia: What Is Venture Capital?
- Investopedia: Hockey Stick Chart
- Investopedia: Internal Rate of Return (IRR)
- Cambridge Associates: When Secondaries Should Come First
- EKR Foundation: Kübler-Ross Change Curve