Direct answer: The mere exposure effect is the tendency to like something only because you have seen it often. Zajonc (1968) first stated it. In advertising, repetition raises liking up to a point. After that point, liking falls.
Main condition: The effect is strongest for new and neutral things, for mixed material, and when a delay comes before people judge. Limit: The effect does not turn a bad impressionImpressionThe number of times your ad or page appeared on a screen. An impression is not a person and not a search.Open the glossary into a good one. Exposure makes judgements more extreme, so a bad impression grows too. Liking is also not a purchase.
We read 6 research papers and 3 Meta help pages on 11 October 2026. The account data comes from the 40 Rama Digital ads with the highest spend in the 90 days to 10 October 2026. We do not show ad or audience names. The coffee shop example below is a simulation.
The problem: ads change too soon, or too late
Many business owners change an ad after 3 days because they are bored with it themselves. The owner sees the material dozens of times. A buyer may have seen it once.
The opposite mistake is also common. One retarget ad runs to 1,600 people for 2 weeks. The same people see the same material 5 times. The cost per result rises, and the comments turn cynical.
The mere exposure effect explains both mistakes. Repetition helps up to a point, then it hurts. This article shows how to read that point from data, not from a feeling. For the rhythm of new material, read the creative production cadence for Meta Ads.
How it works: 2 forces that push against each other
Repeated exposure moves 2 forces. The first force raises liking. The second force lowers it. The result is an inverted U curve.
Familiarity grows without conscious memory
Zajonc (1968) proposed that repeated exposure alone improves the attitude toward an object. The word "mere" means the object is only made available to see. There is no reward and no persuasion.
The Kunst-Wilson and Zajonc (1980) study, summarised by Szpunar et al. (2004), showed polygons 5 times, for 1 millisecond each. People chose the polygon they had seen in 60% of pairs. Their recognition of those polygons was 48%, the same as a guess.
So liking can rise even when people do not remember your ad. One explanation summarised by Szpunar et al. (2004) is processing fluency. Something seen before feels easier to process. People read that ease as liking.
Boredom and counterarguments come after the peak
Cacioppo and Petty (1979) played a persuasive message 0, 1, 3, or 5 times. Agreement rose first, then fell as the number of exposures grew. Counterarguments fell first, then rose again. Thoughts unrelated to the topic kept growing.
The same study found that agreement was not related to the number of arguments people recalled. So a person who remembers your ad does not always agree with it.
The curve shape from the meta-analysis
Montoya et al. (2017) analysed 268 curves from 81 articles. The result was a positive slope with a negative quadratic effect, which is an inverted U. That curve appeared for all visual stimuli, but not for audio stimuli.
Bornstein (1989) reviewed 20 years of research after Zajonc. As Szpunar et al. (2004) summarise it, the rise in liking often levels off after about 10 exposures. That number comes from lab experiments, not from a social feed.
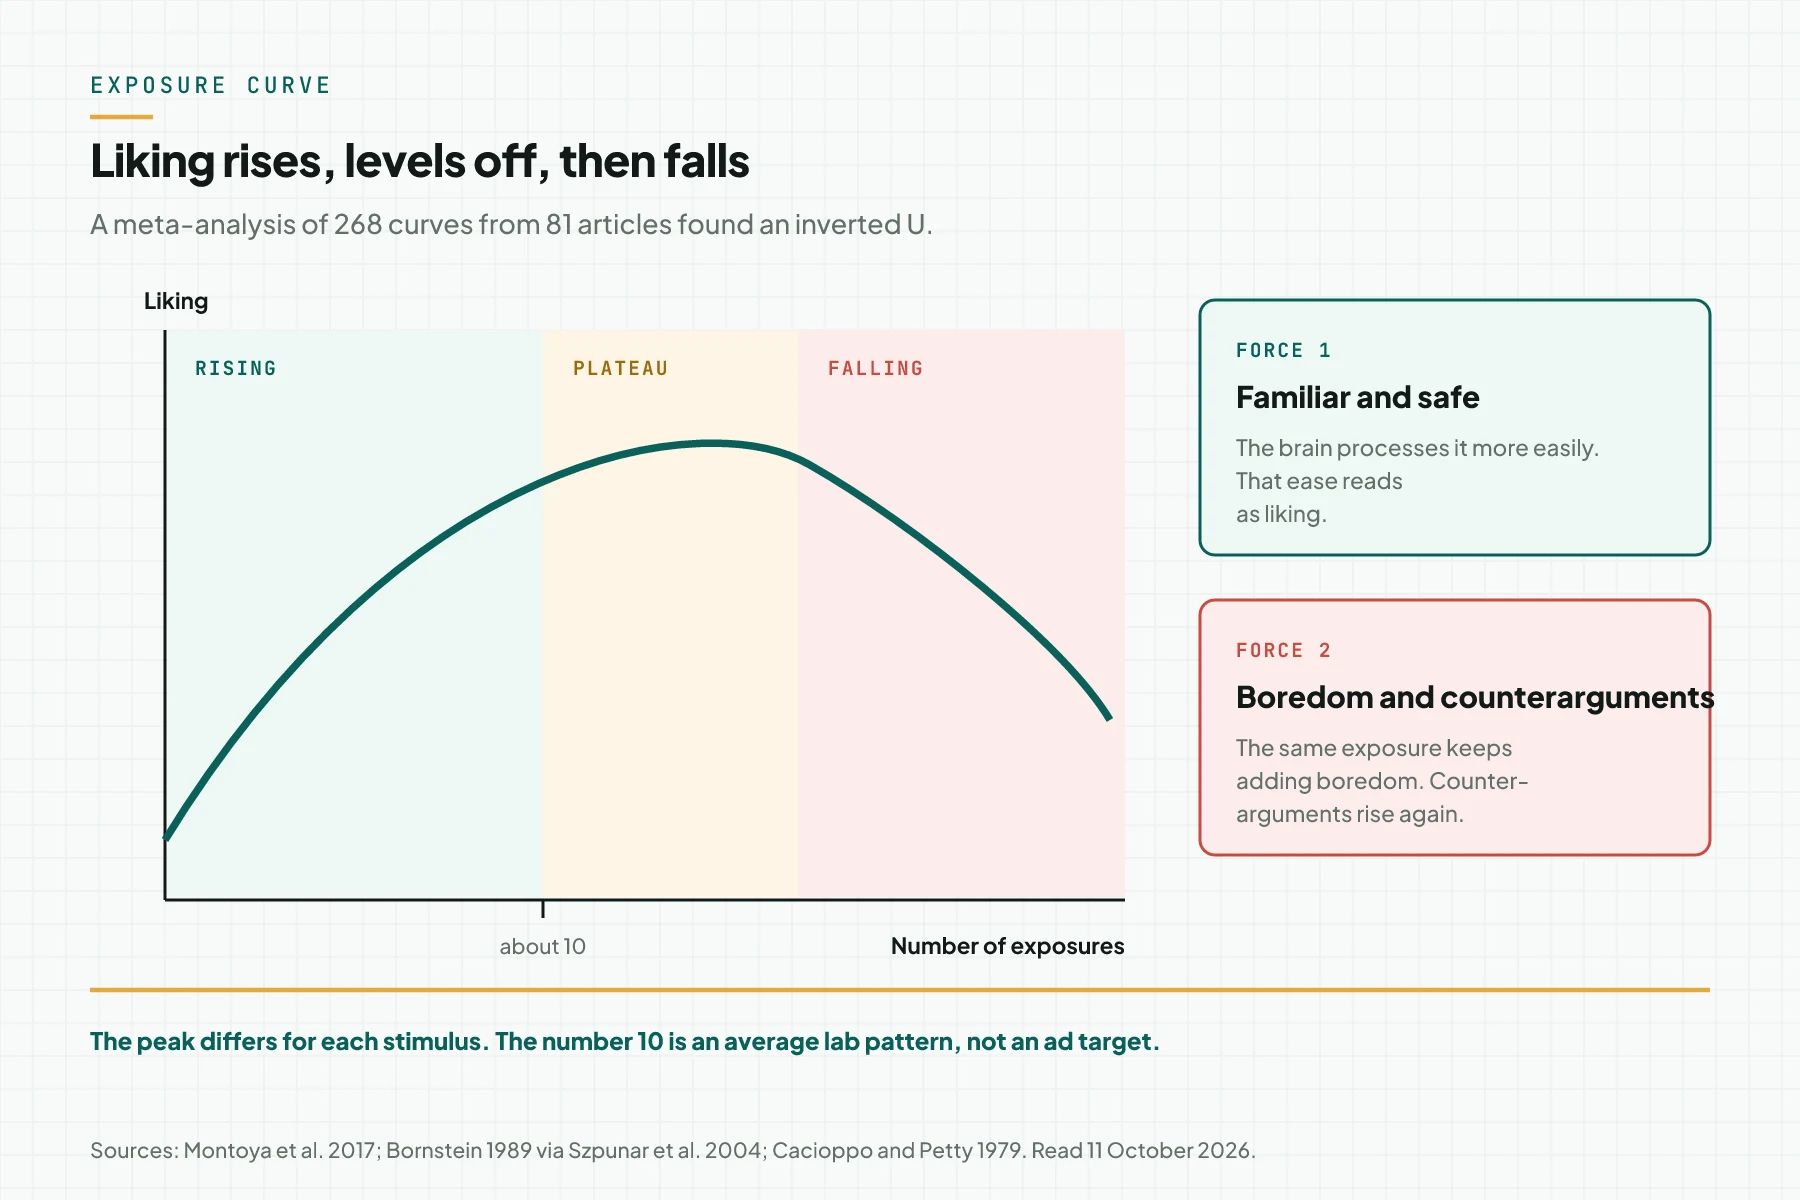
One impression in a feed is not 1 exposure in a lab. In a lab, people look at the stimulus. In a feed, people scroll. So the lab number gives the shape of the curve, not the number of impressions you must buy.
Conditions that make the effect stronger or weaker
Research does not give 1 frequency number for all ads. Research gives conditions. This table lists the conditions closest to an ad decision.
| Condition | Direction of effect | Source | Meaning for ads |
|---|---|---|---|
| Many stimuli in rotation | Stronger than 1 repeated stimulus | Bornstein 1989, via Szpunar et al. 2004 and Mrkva and Van Boven 2020 | Rotate 3 to 5 variations, not 1 piece |
| Complex stimulus | Stronger than a simple stimulus | Bornstein 1989, via Szpunar et al. 2004 | Material with real content survives repetition longer |
| Delay before the judgement | Stronger | Bornstein 1989, via Szpunar et al. 2004 | Put time between first exposure and the offer |
| People unaware of the exposure | Stronger | Bornstein 1989, via Szpunar et al. 2004 | Liking does not wait for brand recall |
| Negative stimulus | Judgement becomes more extreme | Mrkva and Van Boven 2020 | Do not repeat an ad that makes people angry |
Mrkva and Van Boven (2020) show that exposure raises liking, raises salience, and makes judgements more extreme. They also note that exposure raises liking more for neutral and positive stimuli than for negative ones.
What you need before you start
- Meta Ads Manager access with a role that can see reports and edit ads.
- 1 active campaign with 1 clear goal, for example WhatsApp chats or purchases.
- 3 to 5 material variations with the same logo, colour, and brand name.
- 1 baseline number per ad: the cost per result in the first week.
- 1 weekly log sheet for frequency, results, and decisions.
Step 1: Measure real frequency in Ads Manager
Open Ads Manager, choose a date range, then open Columns and choose Delivery. The Frequency column shows how many times, on average, each person saw your ad. The Meta glossary of reservation terms calculates it as impressions divided by reach.
Read frequency per ad, not only per campaign. The campaign number can be low while 1 retarget ad inside it is already high.
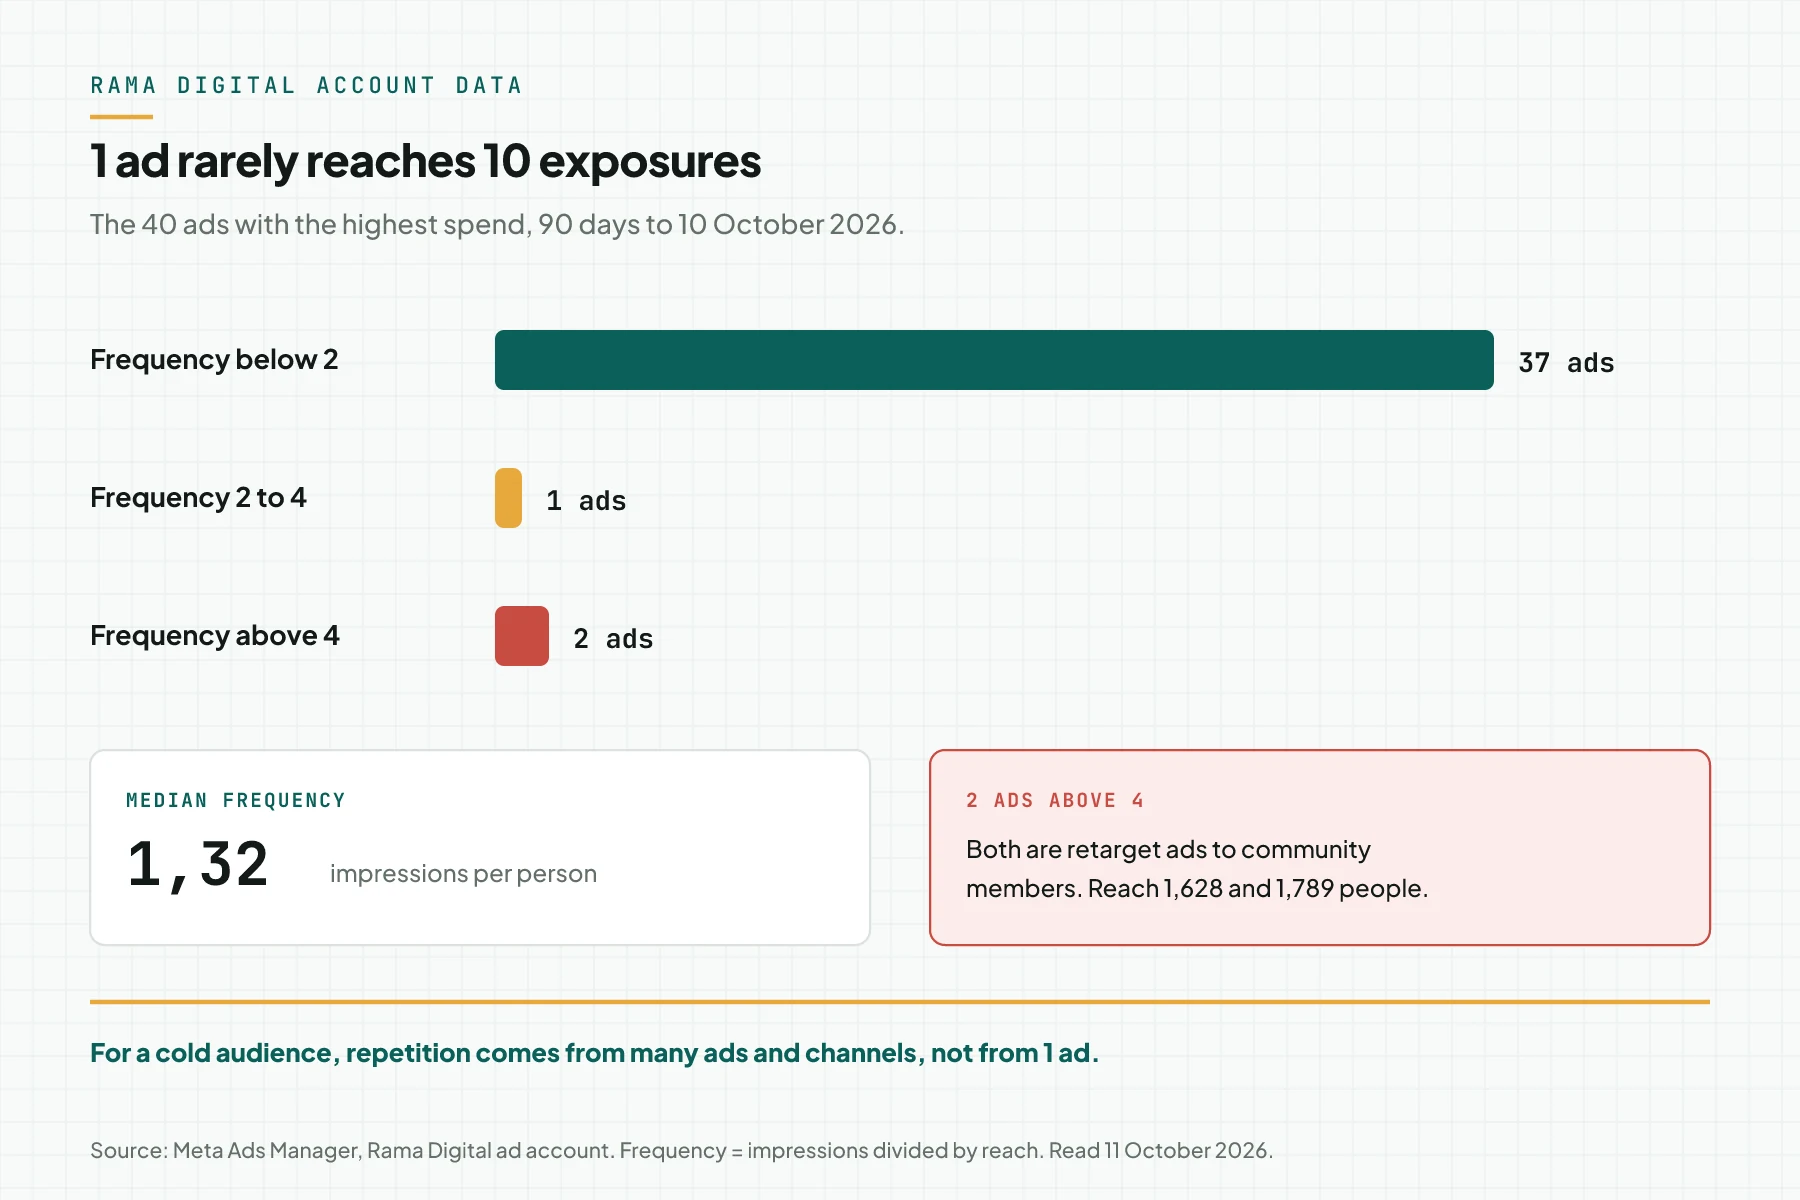
In the Rama Digital account, the 40 ads with the highest spend used Rp16,486,271 in the 90 days to 10 October 2026. Their median frequency was 1.32. In total, 37 ads stayed below 2. Only 2 ads passed 4, and both were retarget ads to fewer than 1,800 people.
So, on a cold audience, 1 ad rarely reaches the exposure counts tested in a lab. Real repetition comes from ads, organic posts, articles, and chats together. Verify: record the frequency of each active ad and flag ads with an audience below 5,000 people.
Step 2: Make variations with 1 fixed brand cue
Make 3 to 5 pieces with different content: the problem, proof, a demo, and the offer. Use the same logo, colour, and brand name on every piece. Bornstein found a stronger effect for stimuli in rotation than for 1 repeated stimulus.
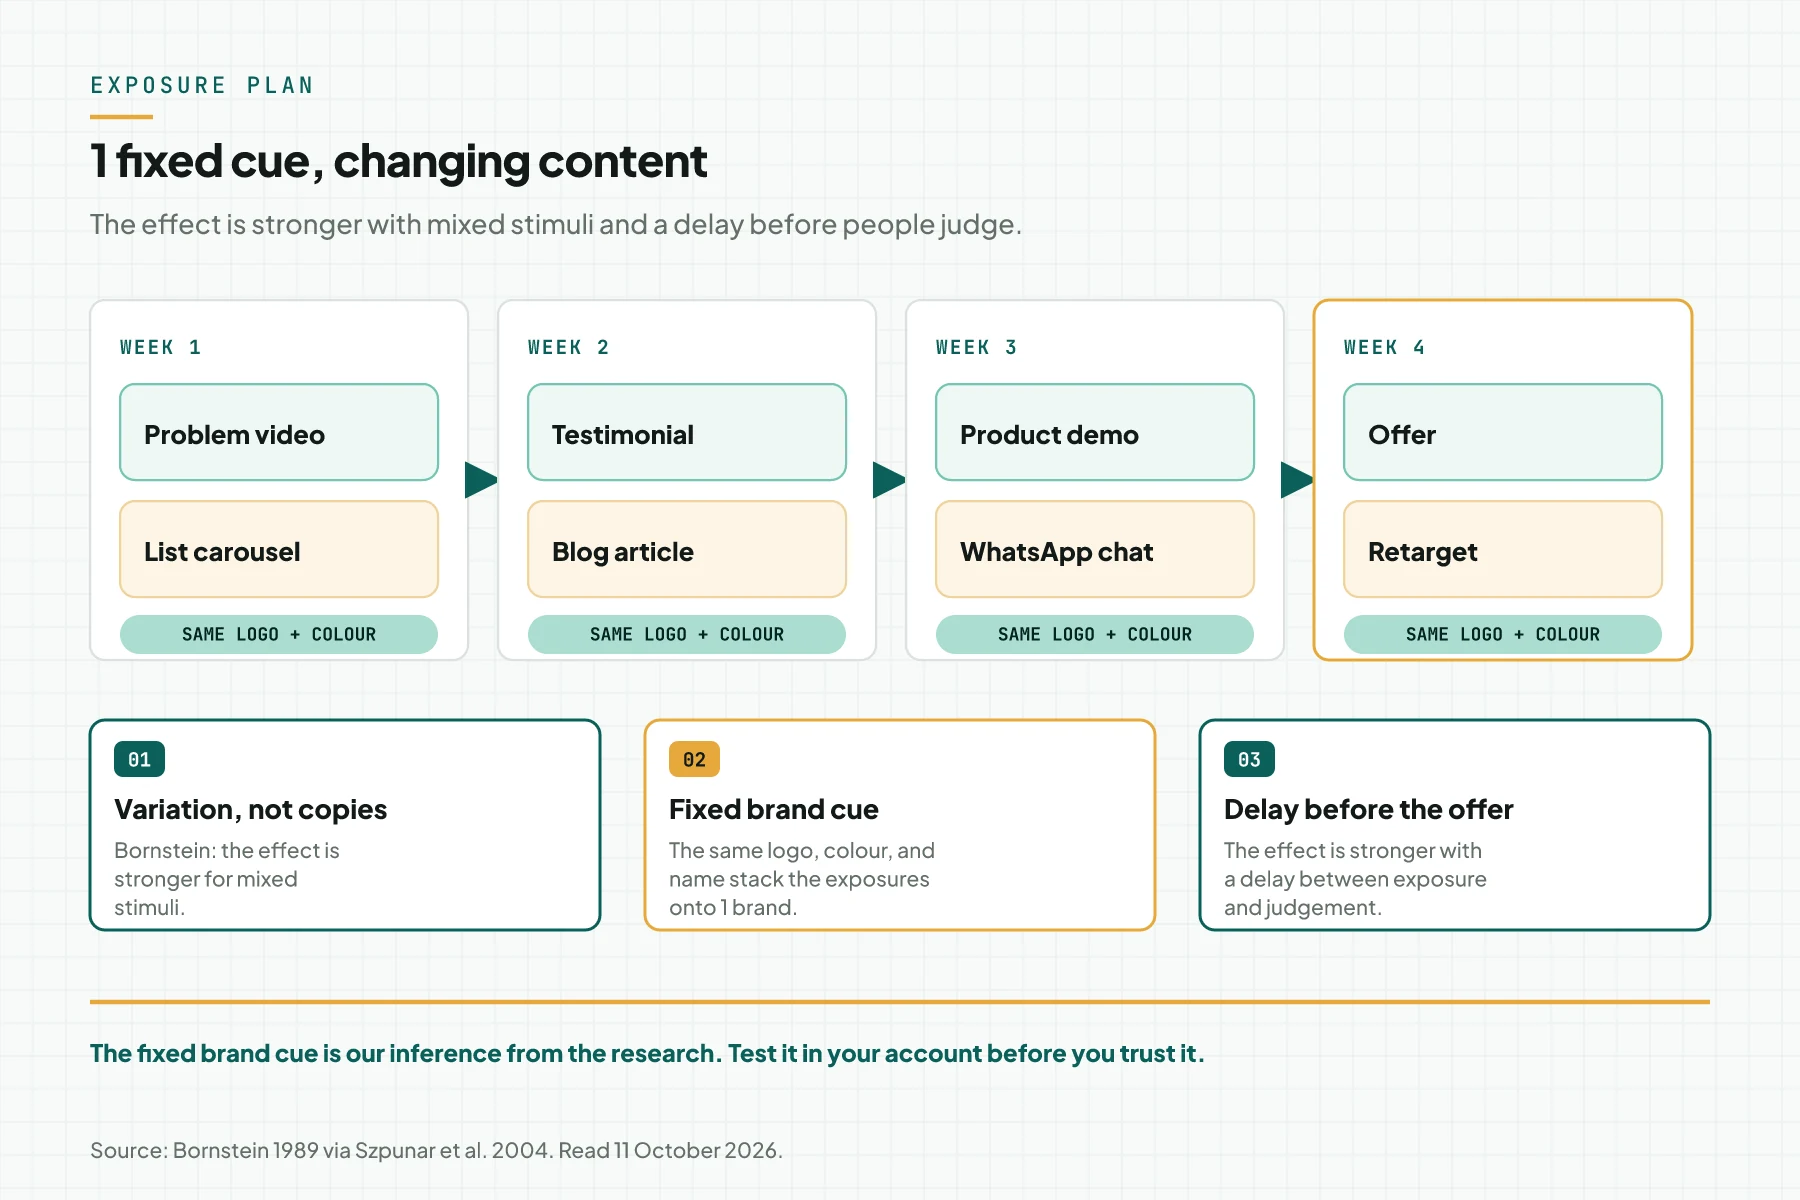
The fixed brand cue is our inference. The research tested stimuli, not brands. Our logic: when every piece carries the same cue, exposures from different pieces stack onto 1 brand. Test this inference in your account.
Plan the order of pieces with the content calendar example. Verify: every new piece carries the same logo and colour, and no 2 pieces are identical.
Step 3: Set the delay and the frequency limit
Do not make the offer on the first exposure for a product people do not know yet. Bornstein recorded a stronger effect when a delay came between exposure and judgement. Put a few days between the introduction and the offer.
The Meta guide to frequency controls describes 2 controls: Target frequency (the average exposures per week) and Frequency cap (the exposure limit in a set period). Both are available on the Awareness and Engagement objectives, with the Reach or ThruPlay goal. With reservation buying, the default cap is 2 impressions every 7 days.
The Meta guide to awareness reach says a known brand needs a lower frequency. A brand people do not know may need a higher frequency. Use this advice when you choose a starting number.
Sales and chat campaigns do not have those controls. Control exposure through audience size and budget. A small retarget audience with a large budget reaches a high frequency fast. To judge new pieces fairly, read how to measure AI creative in Meta Ads.
Step 4: Watch for fatigue signs every week
Compare frequency and cost per result every week on the same ad. The Meta glossary of reservation terms says: when performance starts to drop as frequency rises, the audience may have ad fatigue. Meta advises you to change the creative or the targeting.
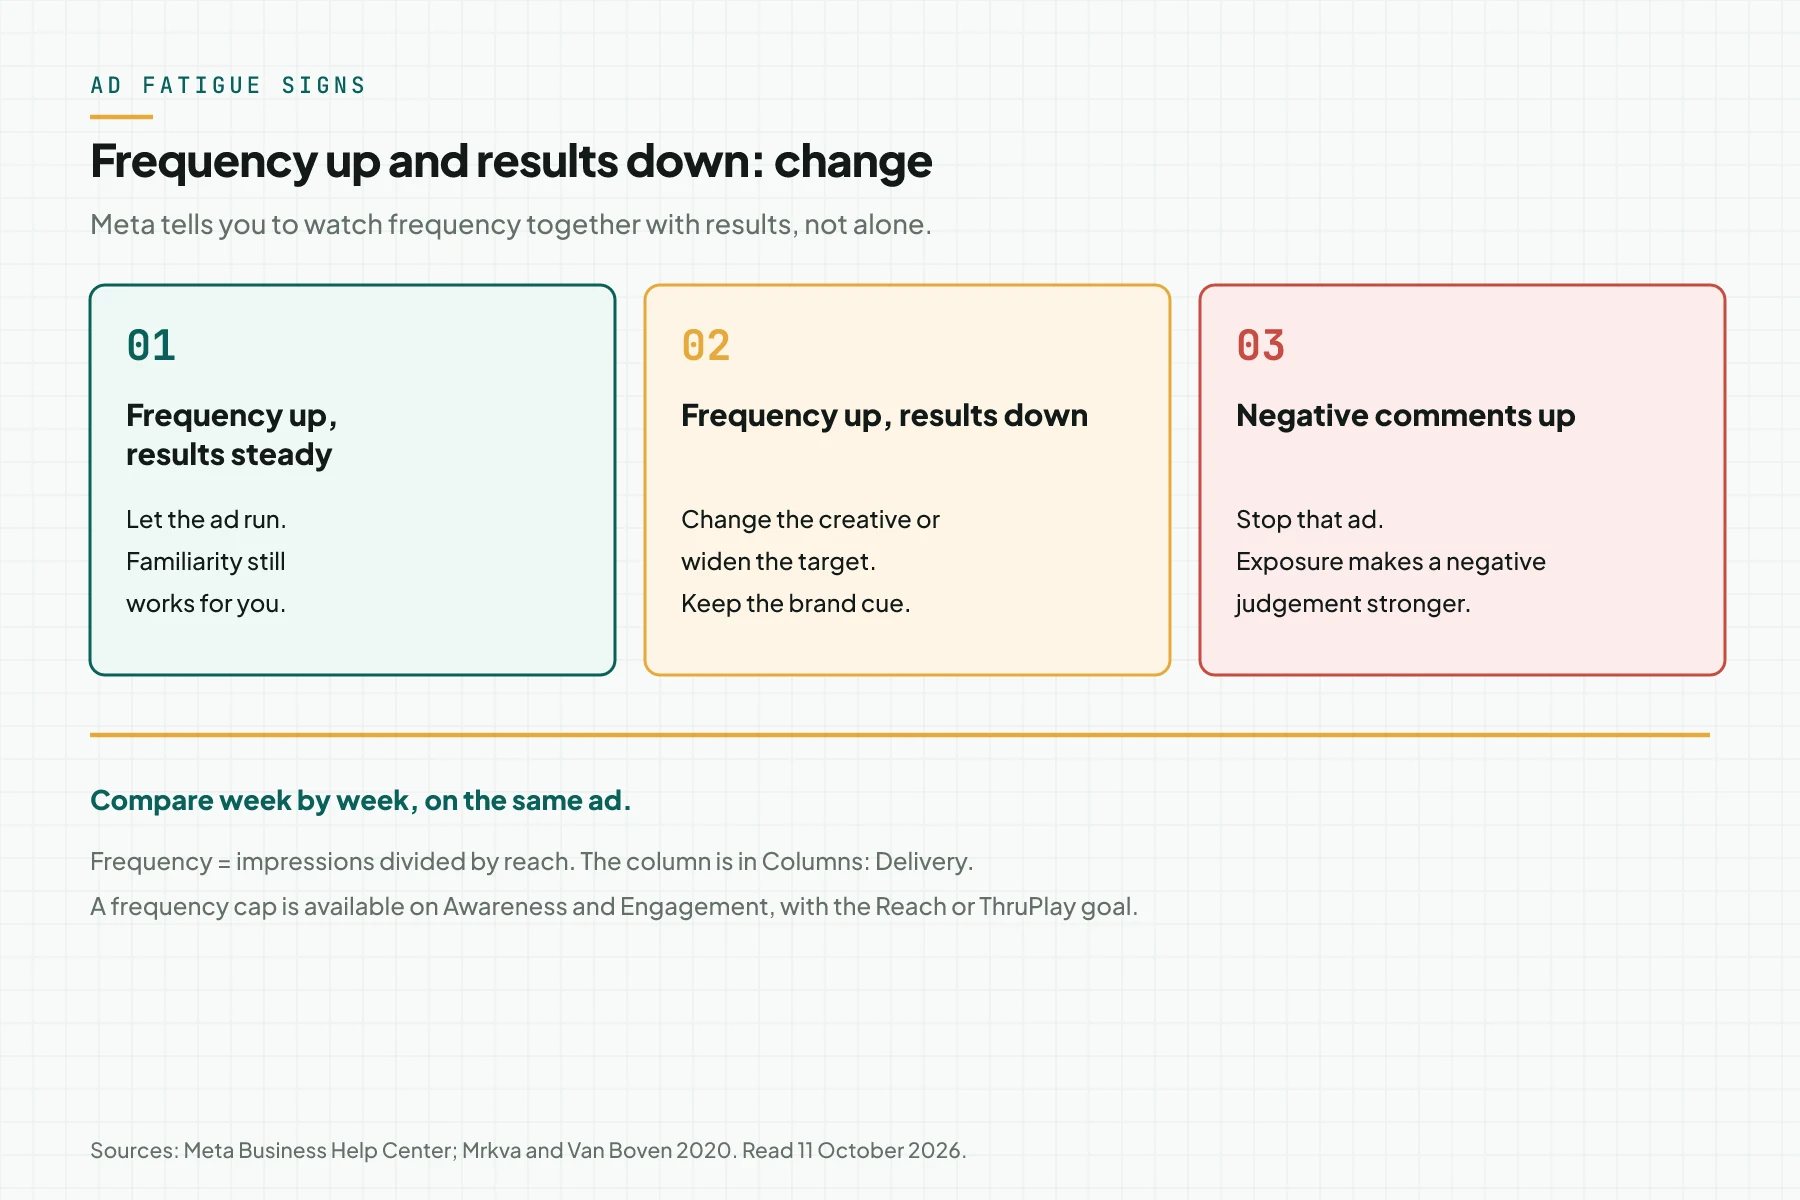
When frequency rises and results stay steady, let the ad run. Familiarity still works. When frequency rises and the cost per result rises for 2 weeks in a row, change the material and keep the brand cue.
When negative comments grow, stop that ad. Exposure makes judgements more extreme, so people who are already annoyed get more annoyed. Verify: the weekly log holds frequency, cost per result, and 1 decision per ad.
Worked example: Lereng Coffee
This is a simulation with dummy data, not customer data. Lereng Coffee sells coffee beans through WhatsApp chat. Ad A is a roasting process video. The retarget audience holds 3,000 people.
| Week | Input | What is recorded | Decision |
|---|---|---|---|
| 1 | Ad A runs | Frequency 1.3; cost per chat Rp18,000 | Keep as the baseline |
| 2 | Ad A keeps running | Frequency 1.9; cost per chat Rp17,500 | Results steady, let it run |
| 3 | Ad A keeps running | Frequency 2.6; cost per chat Rp24,000 | Results down, prepare piece B |
| 4 | Piece B: testimonial, same logo and colour | Frequency of B 1.4; cost per chat Rp19,000 | Cost back near the baseline |
The week 3 decision uses the Meta rule: results fall as frequency rises. The shop does not change the brand, only the content of the piece. The numbers in this table are an example, not a test result.
Checklist for the ad manager
- The ad manager records the frequency of each active ad every week. Evidence: a dated capture of the Delivery columns.
- The ad manager flags ads with an audience below 5,000 people. Evidence: a list of retarget ads and their audience size.
- The designer makes 3 to 5 variations per goal. Evidence: a material folder with version names.
- The designer uses the same logo, colour, and brand name. Evidence: 1 brand sheet that every piece follows.
- The business owner sets a delay between the introduction and the offer. Evidence: the schedule in the content calendar.
- The chat admin reports negative comments and messages per ad. Evidence: a comment list with the ad name.
- Stop and change the material when the cost per result rises for 2 weeks in a row as frequency rises, or when negative comments grow.
Repetition or new material: which comes first
The advice "change the creative every week" and the advice "repeat until people remember" are both too simple. Research shows a curve, not a straight line. Your account data shows where you are on that curve.
Rama Digital recommendation: keep an ad while frequency rises and the cost per result stays steady. Change the content when the cost per result rises together with frequency. This holds for an audience above 5,000 people, whose results you can measure each week.
For a retarget audience below 2,000 people, do not wait for weekly data. Prepare 3 pieces from the start and rotate them from day 1.
Questions people ask
What does the mere exposure effect mean? It means that people tend to like something more only because they see it often, with no other reason. Zajonc wrote this hypothesis in 1968.
What is the ideal ad frequency? Research does not give 1 number for all ads. Lab studies often level off near 10 exposures, but 1 impression in a feed is not 1 exposure in a lab. Use your own cost per result data.
Does the mere exposure effect always work? No. The effect is weak for things people already dislike. Exposure makes judgements more extreme, so an ad that makes people angry is disliked more when it repeats.
How is the mere exposure effect different from ad fatigue? The mere exposure effect is the rising side of the curve. Ad fatigue is the falling side, when boredom and counterarguments win. Both are parts of the same inverted U curve.
Must people remember the ad for the effect to work? No. In the Kunst-Wilson and Zajonc study, people preferred shapes they had seen even when they could not recognise them. Liking can rise without conscious memory.
Next step
The limits still apply: liking is not a purchase, and repetition does not fix a weak offer. Meta Ads Performance Management manages frequency, material rotation, and weekly reports for your Meta Ads account. When you want to read the frequency data of your account first, book a 30 minute initial consultation and bring access to your Ads Manager reports.
Sources
- Zajonc (1968). Attitudinal effects of mere exposure. Journal of Personality and Social Psychology 9(2). Read 11 October 2026.
- Bornstein (1989). Exposure and affect: overview and meta-analysis of research, 1968 to 1987. Psychological Bulletin 106(2). Read 11 October 2026.
- Montoya et al. (2017). A re-examination of the mere exposure effect. Psychological Bulletin 143(5). Read 11 October 2026.
- Cacioppo and Petty (1979). Effects of message repetition and position on cognitive response, recall, and persuasion. Read 11 October 2026.
- Szpunar et al. (2004). Liking and memory for musical stimuli as a function of exposure. Summary of Bornstein and Kunst-Wilson. Read 11 October 2026.
- Mrkva and Van Boven (2020). Salience theory of mere exposure. Read 11 October 2026.
- Meta glossary of reservation terms. Definition of frequency and ad fatigue. Read 11 October 2026.
- Meta guide to frequency controls. Target frequency and frequency cap. Read 11 October 2026.
- Meta guide to awareness reach. Frequency for known and unknown brands. Read 11 October 2026.